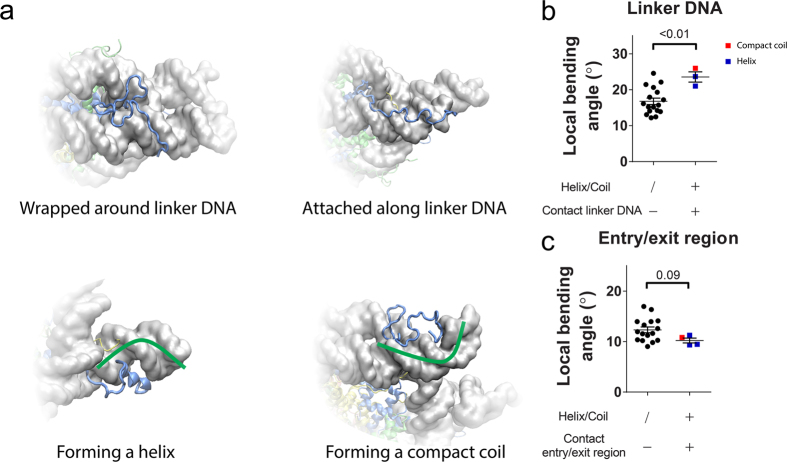
Figure 4. Representative interaction patterns of H3NtT to DNA and DNA bending.
(a) H3NtT is wrapped around DNA along its minor groove (top left). H3NtT is attached to DNA and arranged parallel to it (top right). H3NtT forms an α-helix on the external side of DNA (bottom left). H3NtT is curled up on the external side of DNA (bottom right). (b) DNA local bending at linker DNA. (c) DNA local bending at entry/exit region. Standard errors in the figures are calculated from the independent distances obtained from different simulation runs. The P-value is calculated by two-tailed t-test.

