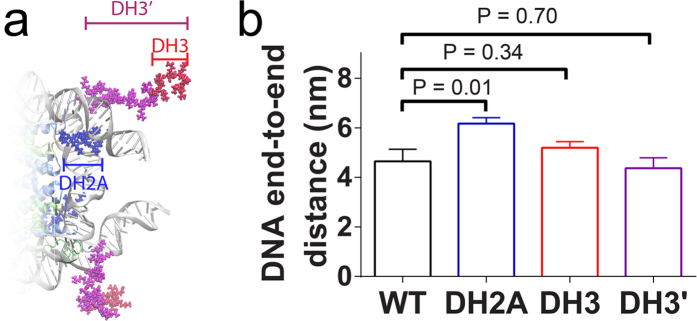
Figure 5. Impact of tail truncation.
(a) Truncated sites of H3NtT (DH3 and DH3′) and H2ACtT (DH2) tails are shown in red, magenta, and blue respectively. In each case, both copies of histone tails are truncated. (b) A comparison of the end-to-end distance between the intact nucleosome and H2ACtT or H3NtT truncation nucleosomes. Standard errors in the figure are calculated from the independent distances obtained from different simulation runs. The P-value is calculated by two-tailed t-test.

