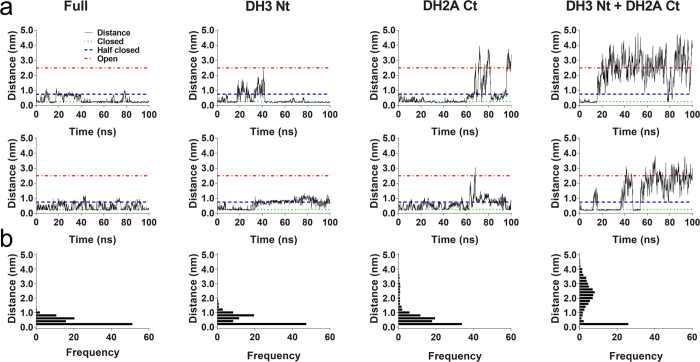
Figure 6. The minimal DNA distance.
Simulations started with a closed conformation for the intact system, and those with truncation of H3NtT, H2ACtT or both tails. (a) The minimal DNA end-to-end distance over time for the different systems in different columns, as labeled on the top. The upper row and lower row are for two independent simulations for each system. (b) Distribution of the minimal end-to-end distances obtained by two independent runs for each of different systems.

