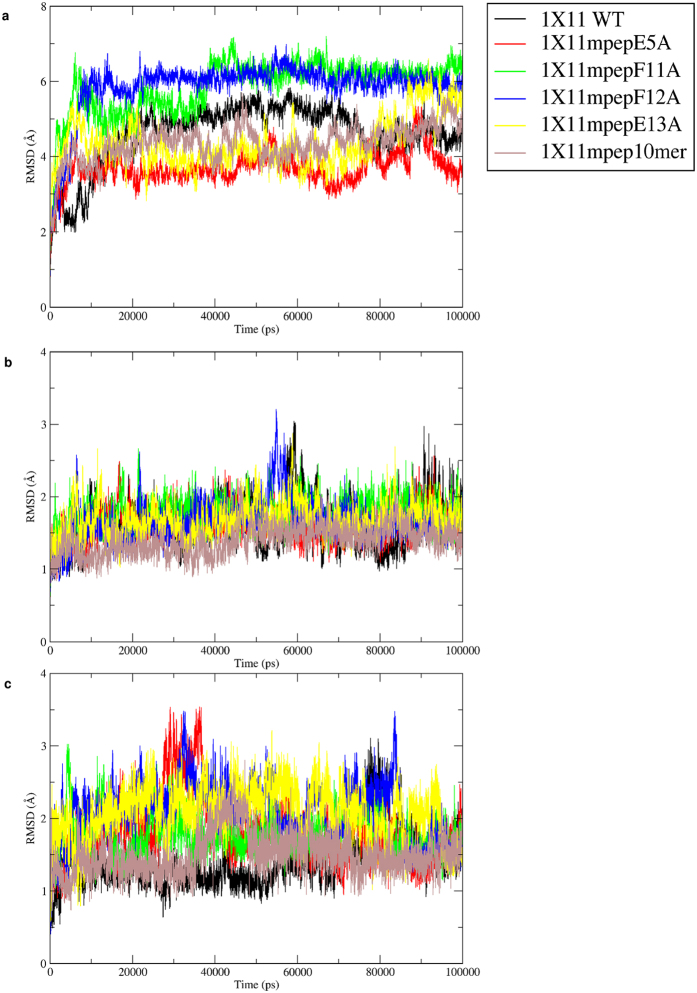
Figure 3. RMSD plot of X11 PTB domain and its mutants.
(A) RMSD vs Time plot for the 100 ns MD simulation on PTB domain of X11 protein in complex with its cognate peptide (PDB ID: 1X11) and the mutated peptides. The inset shows color coding for different simulations. (B) RMSD vs Time plot for the 100 ns MD simulation on PTB domain of X11 protein in complex with its cognate and mutated peptides. RMSD has been calculated excluding the loop regions (represented as dotted line in Fig. 1). (C) RMSD vs Time plot for the peptides only obtained from the 100 ns MD simulation on PTB domain of X11 protein in complex with its cognate and mutated peptides.

