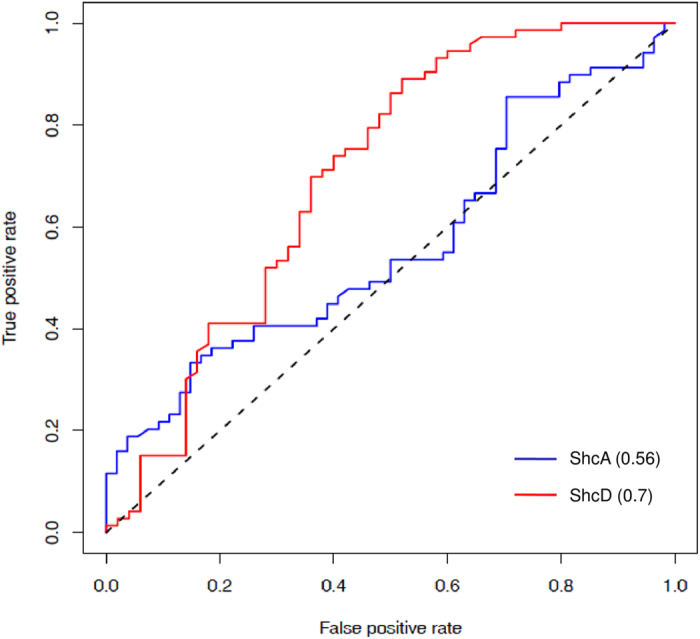
Figure 6. ROC curve for identification of peptide binding partners of ShcA and ShcD PTB domain.

ROC curve for 123 PTB-peptide pairs for ShcA is shown in blue color and for the ShcD PTB domain is shown in red color.

ROC curve for 123 PTB-peptide pairs for ShcA is shown in blue color and for the ShcD PTB domain is shown in red color.