
Figure 6. ROC curve for identification of peptide binding partners of ShcA and ShcD PTB domain.
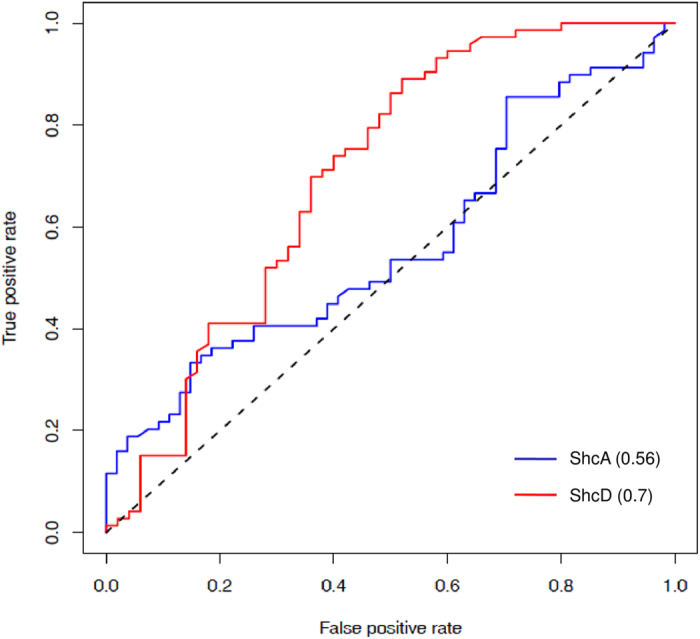
ROC curve for 123 PTB-peptide pairs for ShcA is shown in blue color and for the ShcD PTB domain is shown in red color.
Official websites use .gov
A
.gov website belongs to an official
government organization in the United States.
Secure .gov websites use HTTPS
A lock (
) or https:// means you've safely
connected to the .gov website. Share sensitive
information only on official, secure websites.
ROC curve for 123 PTB-peptide pairs for ShcA is shown in blue color and for the ShcD PTB domain is shown in red color.