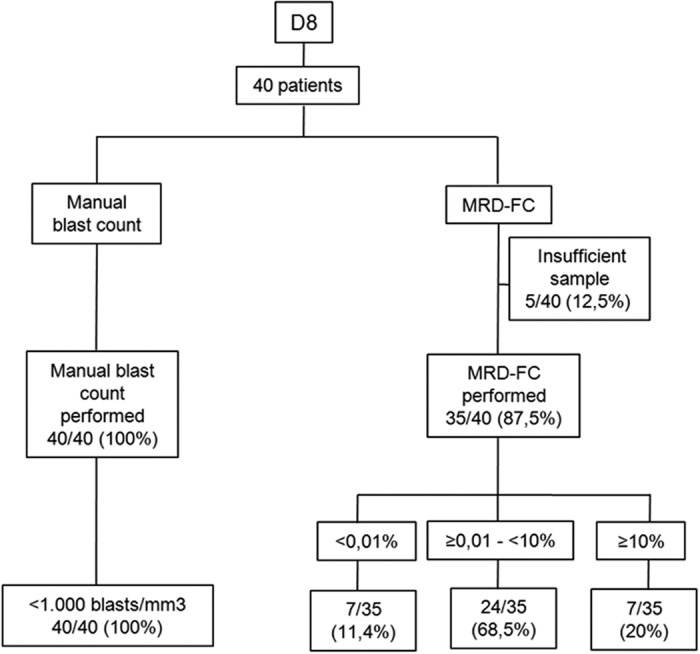
Figure 2. Comparison of manual blast count and MRD levels at day 8.

Flowchart of the comparative analysis between manual blast count and PB MRD detected by flow cytometry (MRD-FC) at day 8.

Flowchart of the comparative analysis between manual blast count and PB MRD detected by flow cytometry (MRD-FC) at day 8.