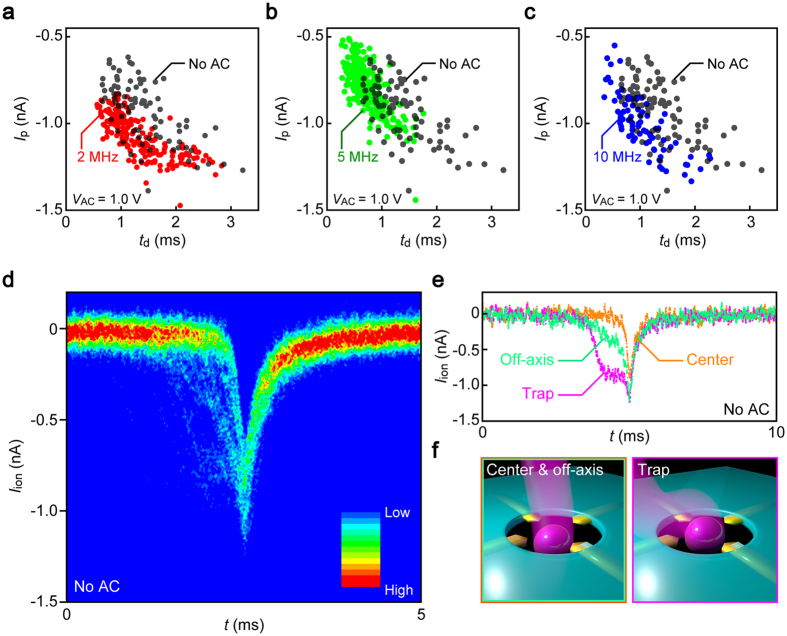
Figure 2. Single-particle translocation modes.
(a–c) Scatter plots of the resistive pulse height Ip versus the width td measured under Vb = 0.2 V and VAC = 1.0 V. The frequency of the AC voltage is 2 MHz (a), 5 MHz (b), and 10 MHz (c). Data obtained under no transverse field are also shown (black plots). (d) Two-dimensional histogram of 79 resistive pulses obtained at Vb = 0.2 V under no transverse field. (e) The three representative Iion curves showing sharp (orange), blunt (cyan), and stepwise features (purple) in the pre-translocation regimes. (f ) The schematic models for the three characteristic Iion signals.

