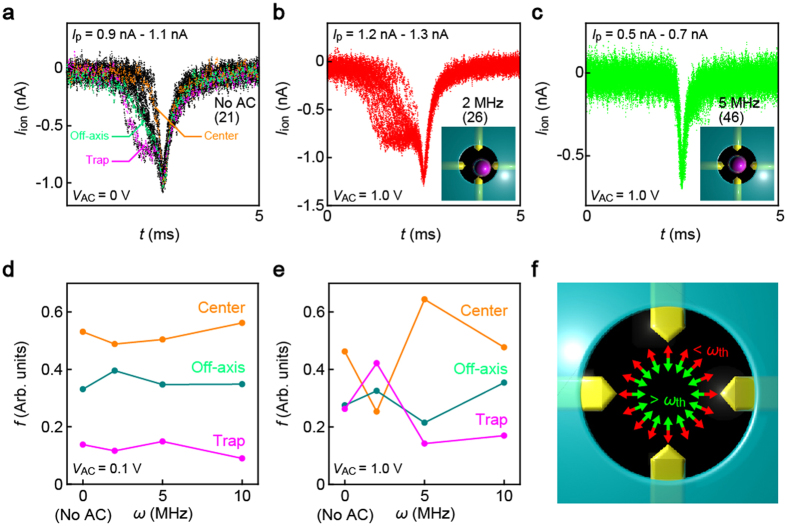
Figure 3. Transverse field controlled single-particle translocation.
(a–c) Overplots of equi-Ip resistive pulses collected from the data obtained under Vb = 0.2 V and VAC = 1.0 V with different transverse AC voltage frequency and Iion windows: No transverse field with a 0.9 nA–1.1 nA window (a); ω = 2 MHz with a 1.2 nA–1.3 nA window; and ω = 5 MHz with a 0.5 nA–0.7 nA window. The number in the parentheses denote the number of signals plotted superimposed. Insets are the images illustrating translocation passages involved in the data. (d,e) The relative occurrence of the three distinct translocation modes, i.e. particle transits through the pore center (orange), off-axis positions (green), and those accompanying temporal traps at the embedded electrodes (purple). (f) Schematic explanations of the transverse field-dependent dielectrophoretic forces pointing toward the electrodes (red) and the pore center (green) at voltage frequencies lower and higher than the threshold ωth, respectively.

