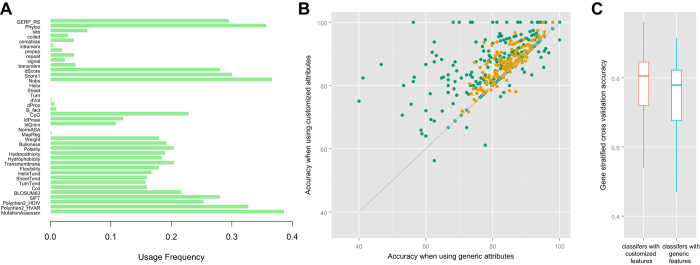
Figure 2. Evaluation of gene-specific and family-specific customized classifiers and comparison with generic classifiers.
(A) The usage frequency of each candidate attributes in these customized classifiers. The y-axis represents the 40 candidate attributes, and the x-axis represents their usage frequency in all classifiers. (B) Comparison of cross-validation accuracies using the customized attributes (Y-axis) vs. using the generic attributes (X-axis). Each point represents a gene (green) or a gene family (orange) that had enough training SNVs for customized attributes and classifiers. (C) Evaluation of the gene-family specific classifiers using gene stratified cross validation (leave variants on one gene out). The gene-family specific classifiers with customized features achieved higher accuracies than the classifiers using generic features.

