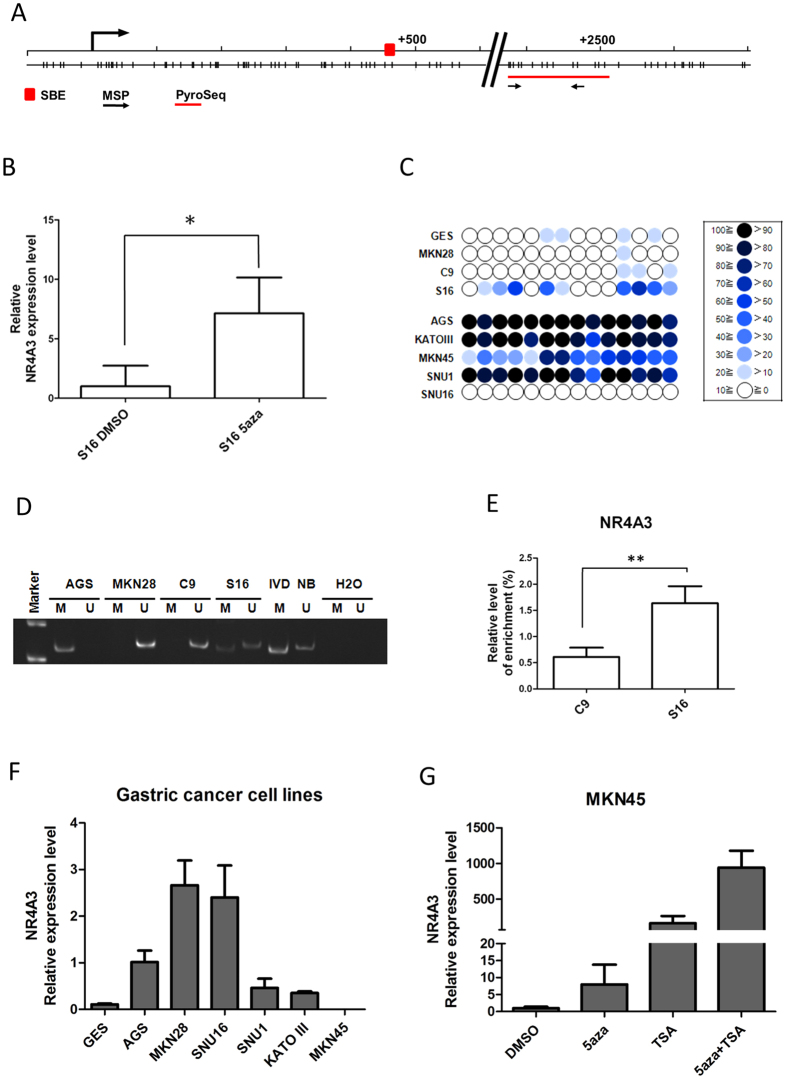
Figure 2. NR4A3 is repressed by promoter DNA methylation in S16 and other gastric cancer cells.
(A) Schematic diagram showing the genomic map of the NR4A3 promoter, with corresponding locations of CpG sites and a putative STAT3-binding element (SBE, red box). CpG sites interrogated by bisulphite prosequencing (PyroSeq) and MSP are indicated by the red line and black arrows, respectively. (B) NR4A3 expression in S16 cells, following DNA demethylation treatment with 0.5 μM 5-aza-2′-deoxycytidine (5-aza) or DMSO control, was examined by qRT-PCR. As depicted, 5-aza treatment significantly restored NR4A3 expression (*P < 0.05). (C) Bisulphite pyrosequencing was performed to quantitatively examine the methylation levels of 14 CpG sites within the NR4A3 promoter CpG island in C9, S16, and other gastric cancer (GC) cell lines. The percent methylation of each CpG site (circle) is indicated by the intensity of the blue color. NR4A3 promoter methylation was also examined by (D) methylation-specific PCR (MSP) and (E) methyl-binding protein DNA capture (MBDcap) coupled to PCR. For MSP, bisulphite-modified DNA was PCR-amplified using specific primers. “M” and “U” indicate the presence of methylated and unmethylated alleles, respectively. IVD (in vitro methylated DNA) was a positive control for methylation and NB (normal blood) was a negative control for methylation. Water (H2O) was used as a negative control for PCR. In MBDcap-PCR, methylated DNA fragments were immunoprecipitated by MBD protein followed by qPCR (**P < 0.001). (F) Relative expression of NR4A3 in GC lines and (G) 5-aza-treated MKN45 GC cells, as determined by qRT-PCR. Each bar represents mean± SD of dupliate experiments.

