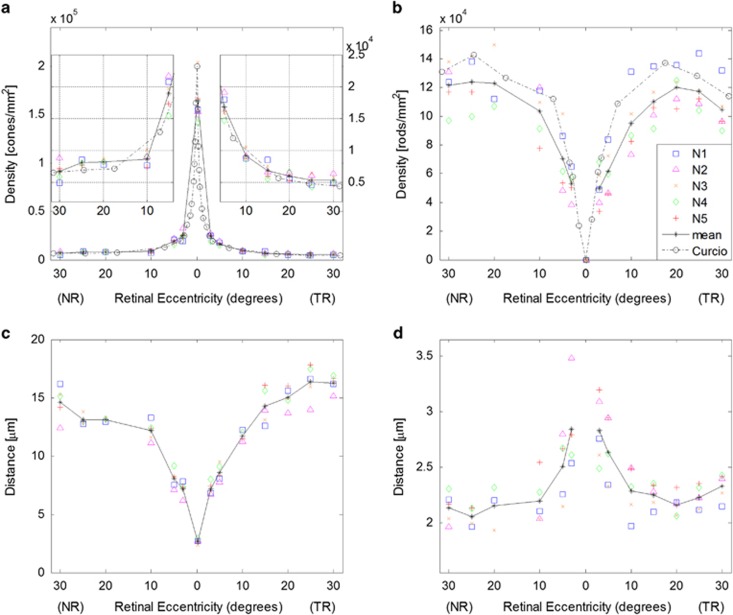
Figure 2.
Photoreceptor density and spacing measurements for all five subjects as a function of retinal eccentricity. Results from individual subjects are denoted by the symbols, and the solid black line shows the mean. (a) Cone densities from the fovea to 30° NR and TR. The inset graphs show the 5–30° NR and TR data on expanded ordinate axes with scaling shown to the right; (b) rod density; (c) cone center-to-center spacing; and (d) rod center-to-center spacing. The black dashed lines in a and b show corresponding mean density results from Curcio et al4 assuming 1°=290 μm.

