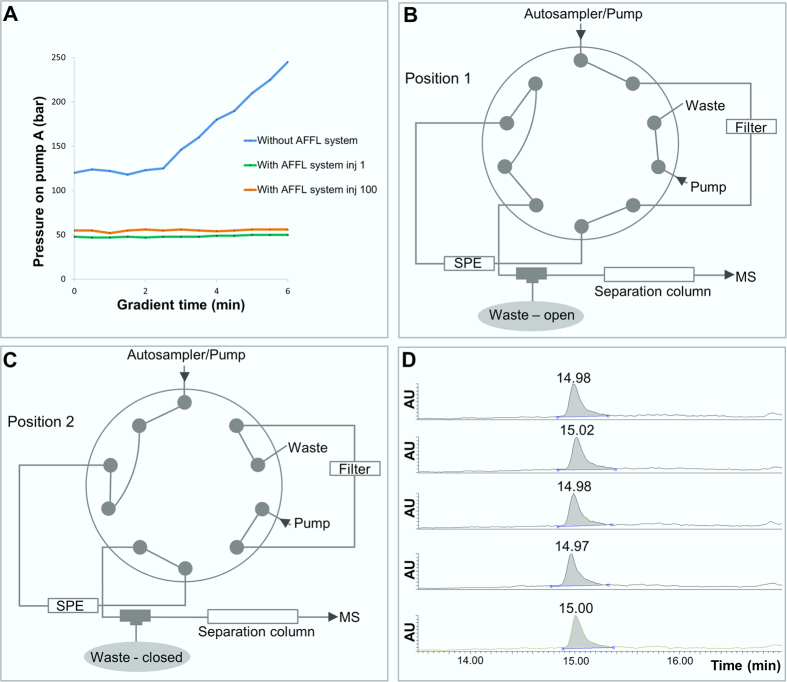
Figure 1. AFFL-SPE-nanoLC-MS for plasma analysis.
(A) Pressure profiles on pump A of the Easy nLC pump, during a 6 minutes gradient (0–90% B) at a flow rate 800 nL/min, when injecting a plasma sample without the AFFL system (blue line). The green line illustrates the pressure profile during the gradient for the first plasma sample injected when the AFFL system was incorporated, while the orange line illustrates the pressure profile during the gradient for the hundredth plasma injection onto the AFFL system. (B) Position 1 of the external 10-port valve. In this position the particles are retained on the filter, while hydrophobic compounds (including OT) is retained on the SPE and salts and hydrophilic compounds are eluted to waste. (C) Position 2 of the external 10-port valve. The filter is being back-flushed, and hydrophobic compounds are eluted off the SPE and separated on the separation column before detection by MS. (D) Five injections of plasma sample spiked with OT to a final concentration of 500 pg/mL.

