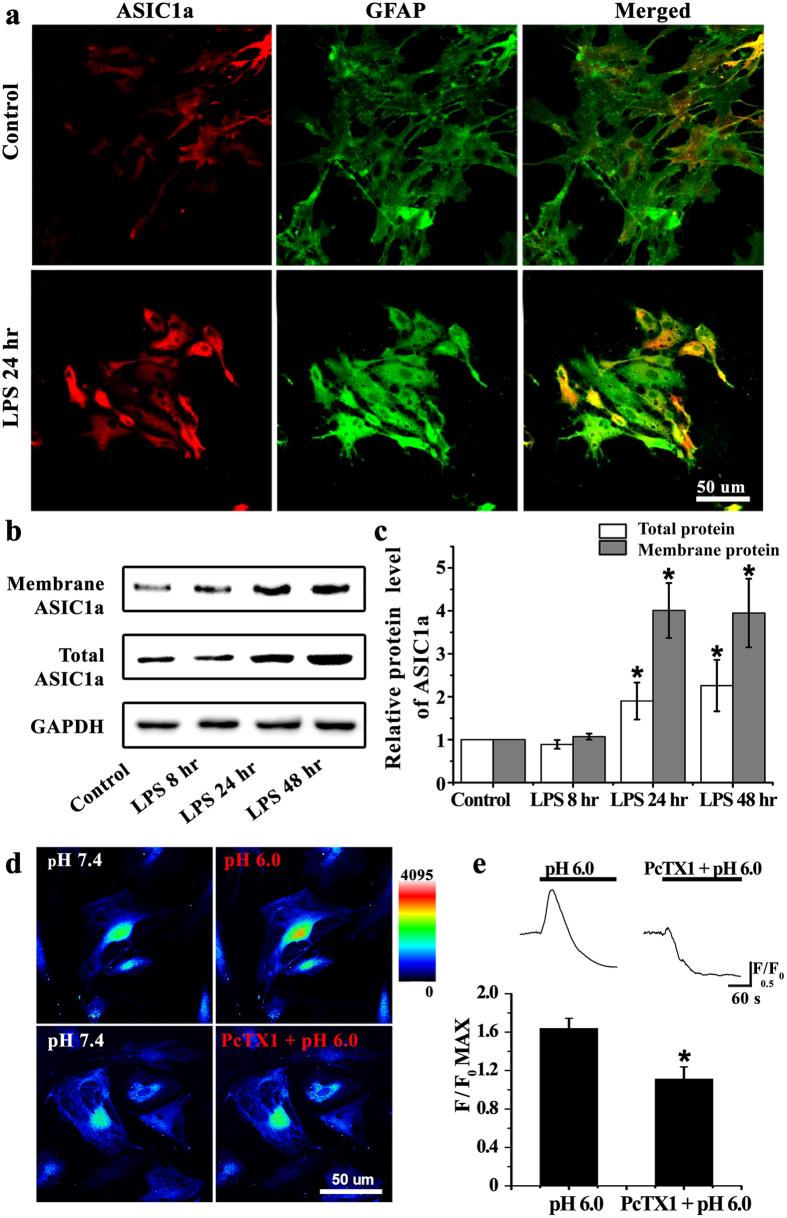
Figure 3. Increased expression of astrocytic ASIC1a mediated Ca2+ elevation in LPS-treated astrocytes.
(a) ASIC1a (red) and GFAP (green) immunofluorescence staining was performed in cultured astrocytes. Compared with the control group, the number of ASIC1a-positive astrocytes markedly increased at 24 hours after LPS treatment. (b) Western blots for membrane and total ASIC1a protein in control and LPS-treated astrocytes at 8, 24, and 48 hours after treatment. (c) Densitometric quantification of the membrane and total ASIC1a protein expression, normalized to GAPDH. *P < 0.05, ANOVA followed by Dunnett’s post-hoc test vs. control. (d) Representative changes of intracellular Ca2+ concentration in response to extracellular pH reduction (from 7.4 to 6.0) in the absence and presence of 5 nM PcTX1. Warmer colors indicated higher fluorescence intensity. (e) Time course and quantification of fluorescence intensity. Peak fluorescence intensity was normalized to fluorescence intensity at baseline (F/F0 max) in the pH 6.0 (n = 24) and PcTX1 + pH 6.0 (n = 21) groups. *P < 0.05, t test vs. pH 6.0 group.

