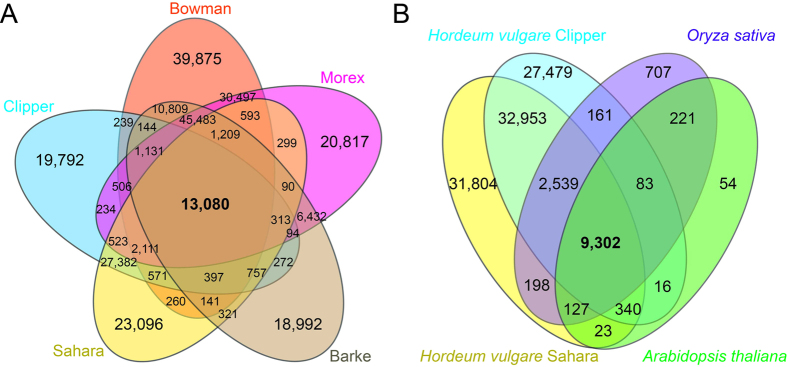
Figure 2. Transcript sequence comparisons of Hordeum genotypes and between other plant species.
(A) Transcript sequence comparison of transcriptomes of five Hordeum genotypes. Distribution of orthologous groups (OG) amongst barley genotypes from both the MIPS consortium and de novo sequencing. (B) Transcript sequence comparison between Hordeum genotypes Clipper and Sahara, and a model eudicot (Arabidopsis thaliana), as well as a model monocot (Oryza sativa) transcriptomes. OrthoFinder (v0.2.823) was used for identification of orthologous groups. Shape and colour used for each species is noted with the total number of shared OGs between each species.

