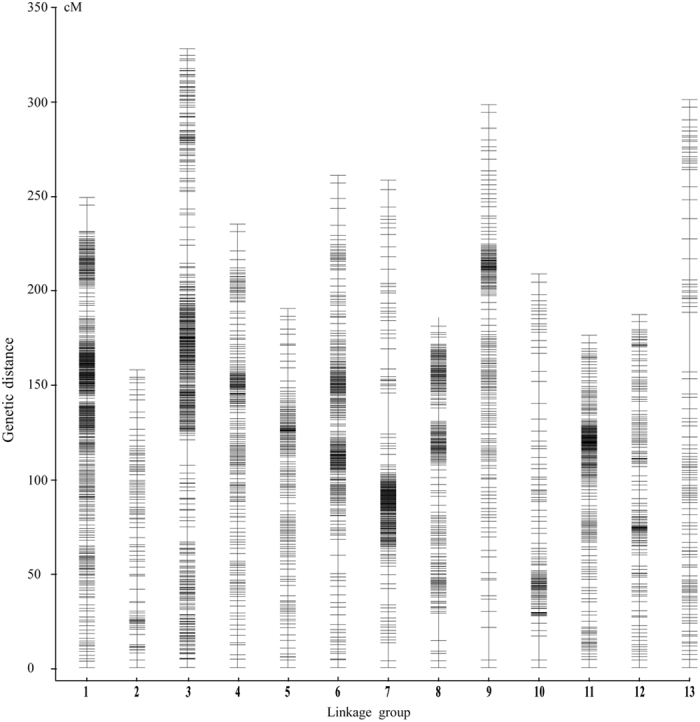
Figure 1. Distribution of SNP markers in 13 linkage groups of the ultra-dense SNP map.

Bars indicate SNP markers. The x- axis indicates the linkage group (LG) and the y-axis indicates genetic distance in centi Morgans (cM). A total of 30,193 SNP markers were mapped to the 13 LGs. The 13 LGs were randomly designated as LG1-LG13.
