Figure 3.

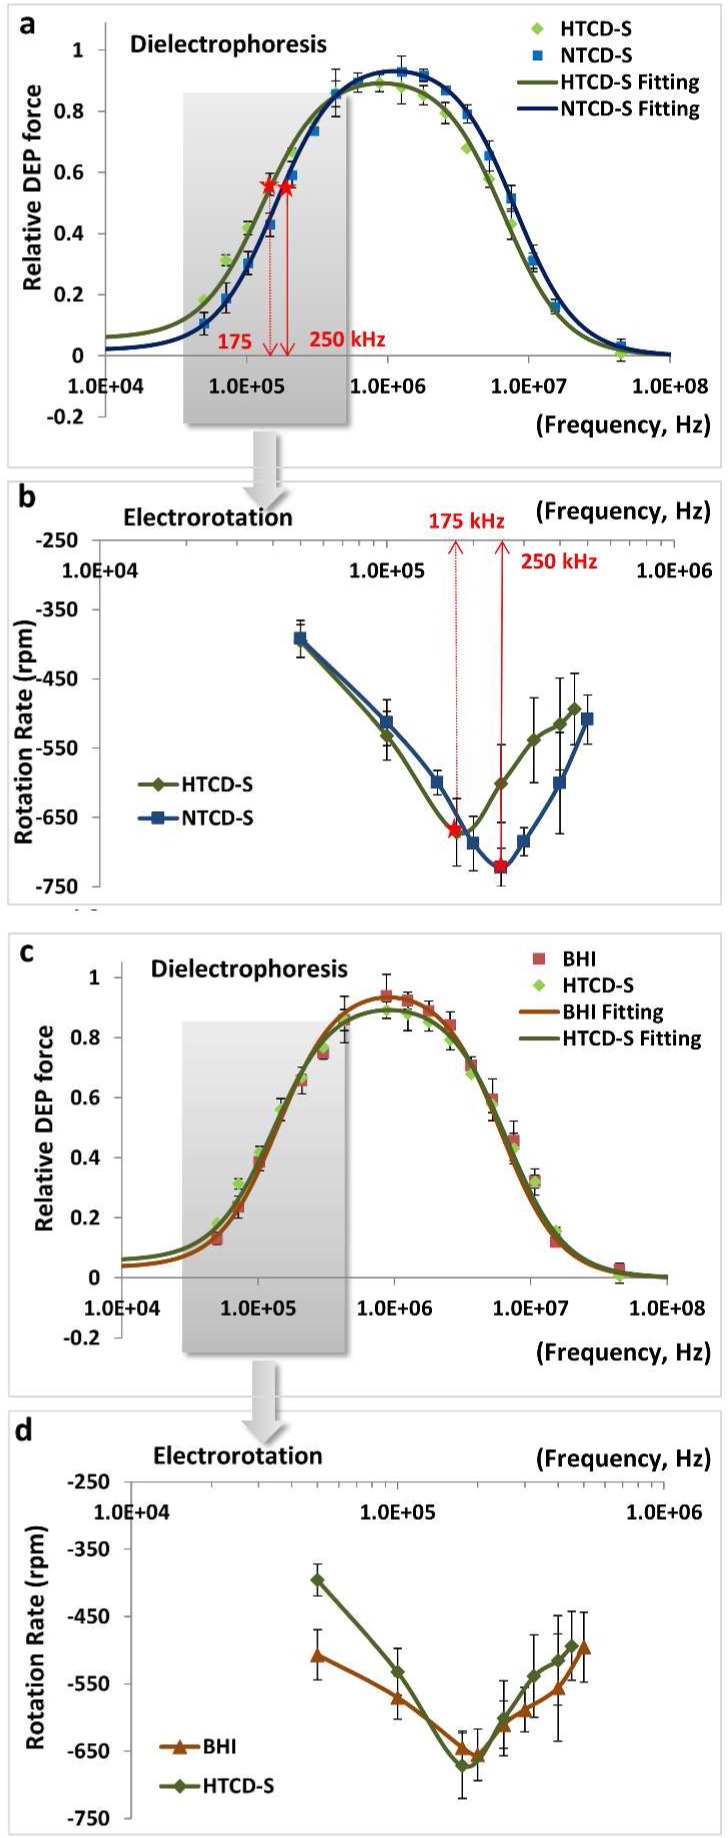
HTCD cultured in HTCD-S versus in NTCD-S, analyzed on the basis of (a) DEP spectra (50 kHz–45 MHz) and (c) ROT spectra (50 kHz–500 kHz), with the respective control measurement of HTCD cultured in BHI versus in HTCD-S: (b) DEP spectra and (d) ROT spectra. The DEP responses are fit to eq 2 (Supporting Information) to compute C. difficile electrophysiology (Table 1), with red star symbols on plots indicating the particular frequencies of DEP inflection (a), which correspond to the frequencies of the highest counter-field rotation rate (b). See ROT video: ROT2.mov in Supporting Information.
