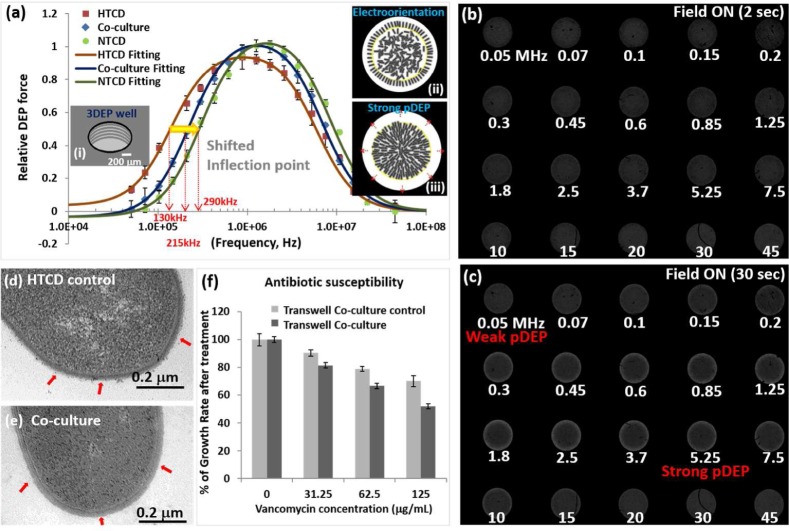
Figure 4.
(a) DEP spectra (50 kHz–45 MHz) of HTCD co-cultured in NTCD versus in the respective co-culture control and the pure NTCD culture (video DEP1.mov in SI). The fitted DEP response under each culture condition (using eq 2 Supporting Information) is applied to compute dielectric parameters of the C. difficile cell envelope and cytoplasm (Table 1). Schematic images show (i) rings of conducting electrode strips patterned inside the wall of a 3D well; (ii) the cells electro-orient to form a dark band at the edge at early time points; (iii) after 30 s of field, pDEP causes a clear band at the electrode edge (from bands 6–9, with the yellow circle indicating band 6). Representative light intensity images of C. difficile in the 3DEP well device at the indicated frequencies due to electro-orientation after 2 s (b) and pDEP after 30 s (c) are used to determine DEP spectra. Transmission electron microscopy images of (d) the HTCD control and (e) HTCD co-cultured with NTCD (arrows indicate S-layer-induced features). (f) Antibiotic susceptibility of HTCD co-cultured with NTCD versus the co-cultured HTCD control (growth rates normalized to those of untreated cells; i.e., 0 μg/mL vancomycin treatment has a 100% growth rate).

