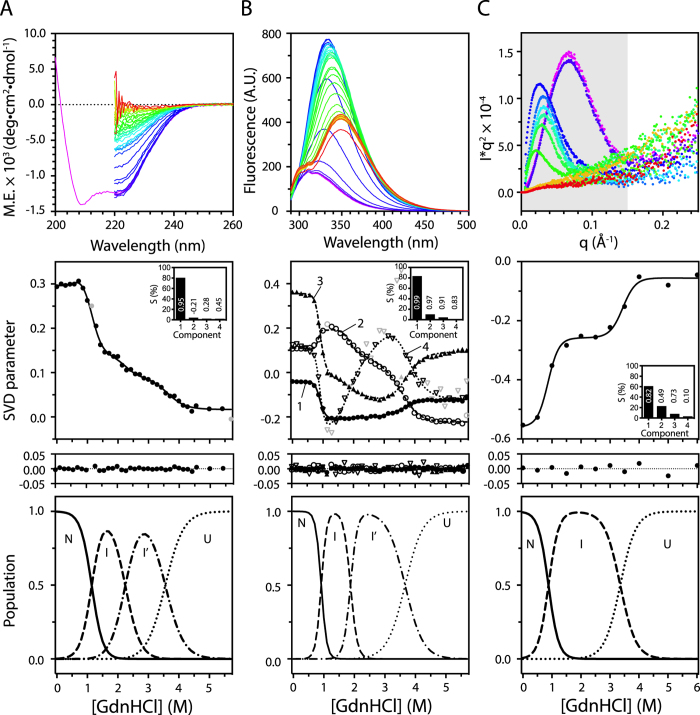
Figure 2.
GdnHCl-induced equilibrium unfolding of DehI monitored by (A) Far-UV CD, (B) intrinsic fluorescence and (C) SAXS. Top panels: GdnHCl titration series of far-UV CD and fluorescence emission spectra of DehI recorded from 0 to 5.7 M GdnHCl with a linear gradient with equal spacing, colored ramped from purple to red. Kratky plots of the SAXS data collected in the presence of 0, 0.5, 1, 1.5, 2, 2.5, 3, 3.5, 4, 5, and 6M GdnHCl. Middle panels: SVD analysis outputs of far-UV CD, intrinsic fluorescence and SAXS data. Insets: the percentage and auto-correlation coefficients individual components. Residuals of data fitting are shown below. Bottom panels: the population of native state (solid line), intermediate state (dashed line) and unfolded state (dotted line) for DehI as a function of GdnHCl concentration. Populations of individual states are calculated using the thermodynamic parameters obtained from the fitting to a three-state or four-state folding model.

