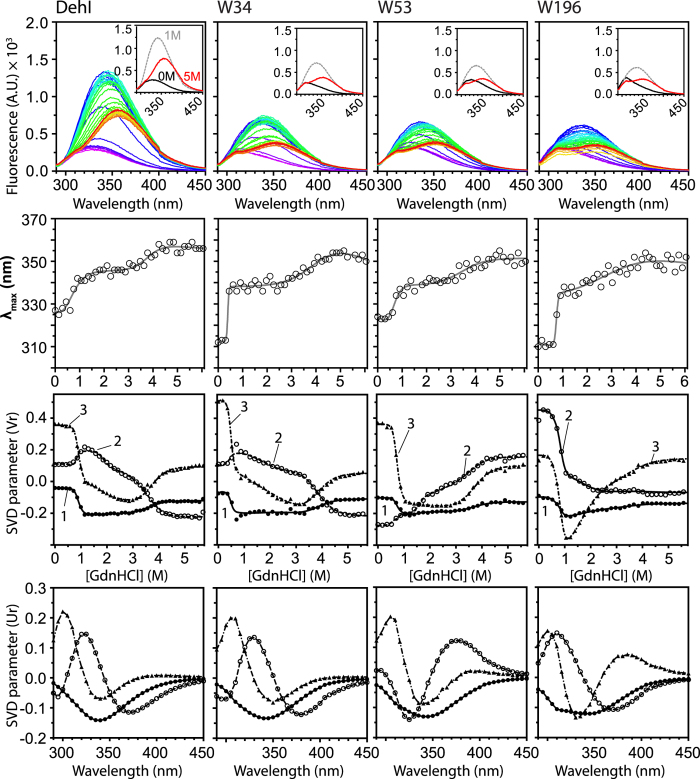
Figure 3. Comparison of the folding equilibria of DehI variants.
The fluorescence emission spectra, maximum emission wavelength (λmax), SVD components Vr (as a function of GdnHCl concentration) and Ur (as a function of wavelength) are shown in descending order for wt, W34, W53 and W196 from left to right. The fluorescence emission spectra recorded from 0 to 6 M GdnHCl are ramped from purple to red. Insets: Three selected spectra in the presence of 0, 1, and 5M GdnHCl colored in black, grey and red, respectively. Significant SVD components Vr are global-fit to a four-state equilibrium unfolding model to extract associated thermodynamics parameters (Table 1).

