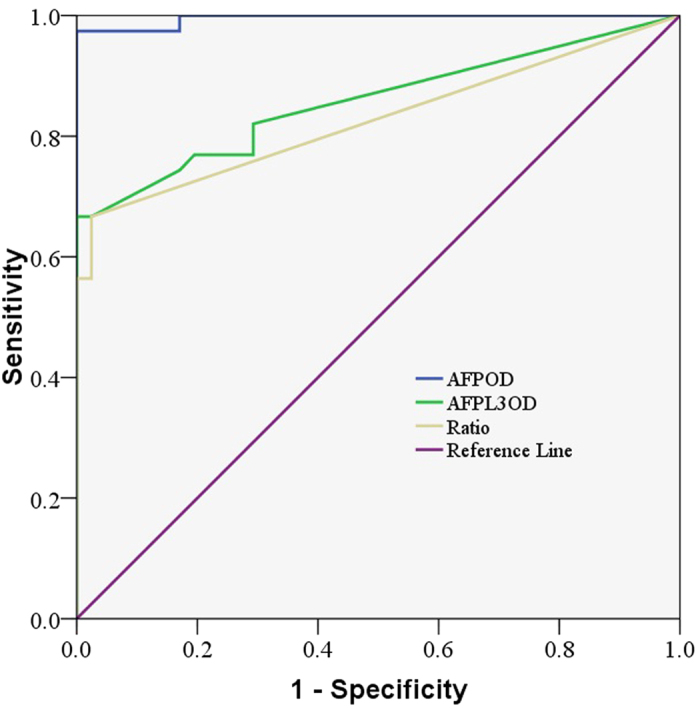
Figure 2. Receiver operating characteristic curve of the serum a-fetoprotein (AFP) and AFP-L3 levels from the protein microarray for the diagnosis of hepatocellular carcinoma in patients with hepatocellular carcinoma and healthy controls (n = 78).

The area under the ROC curve (AUC) indicates the clinical usefulness of a tumor marker. Our results showed that the AFP area under the ROC curve (AUC = 0.996; 95% CI: 0.986–1.005) was much higher than that of AFP-L3 (AU = 0.857; 95% CI: 0.769–0.94) and AFP-L3% (AUC = 0.827; CI: 0.730–0.924).
