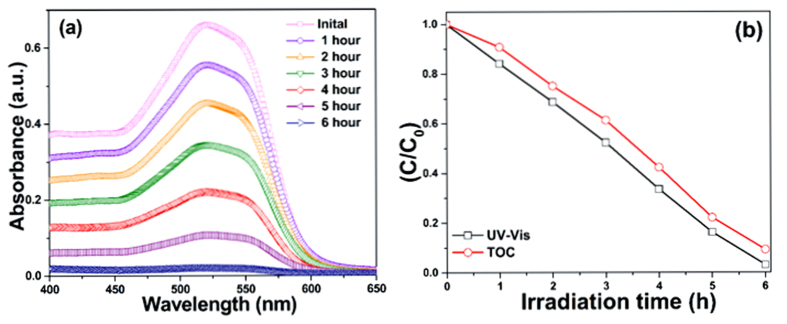
Figure 7.
(a) Change in the absorption spectra of industrial textile effluent during photodecomposition, and (b) UV-vis and TOC plots indicating the degradation and mineralization of the industrial textile effluent using ZnO/CeO2 (90:10) photocatalyst for different exposure times under visible-light irradiation.

