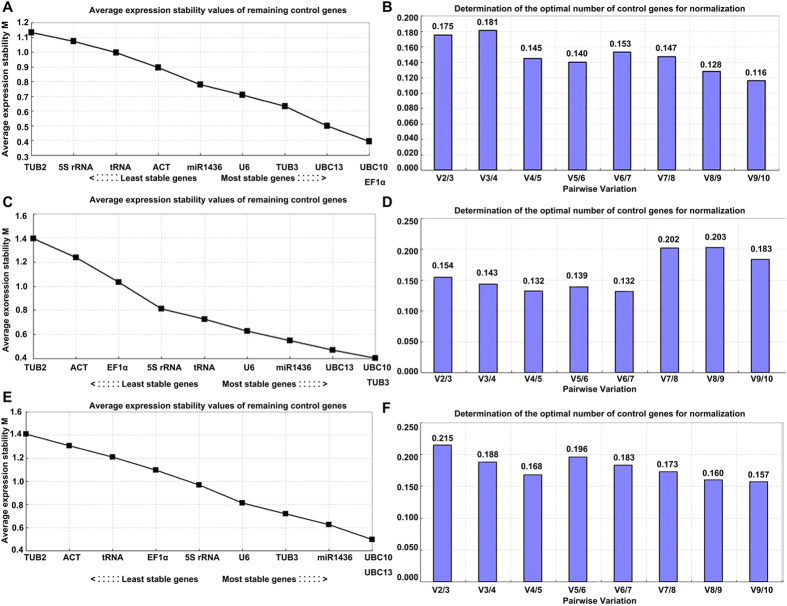
Figure 5. Validation of 10 candidate genes with these samples under separate salt, drought stress and their combination in H. caspica using GeNorm.
(A,C,E) represented average expression stability values (M) of 10 candidate genes and (B,D,F) were determination of the optimal number of candidate genes for normalization by GeNorm analysis. The condition of (A,B) was under salt stress, that of (C,D) was under drought stress and (E,F) under their stressed combination.

