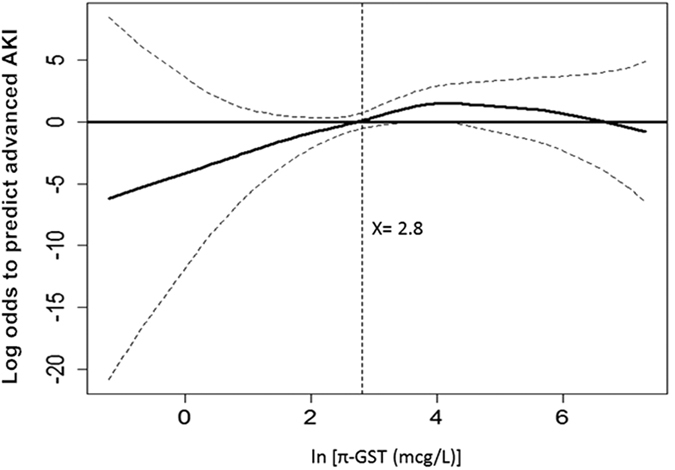
Figure 3. GAM plot for the probability of advanced AKI for urinary π-GST levels at T3 (3 hours post surgery).

The model incorporates the subject-specific (longitudinal) random effects, expressed as the logarithm of the odd (logit). The probability of outcome events was constructed with π-GST level and was centered to have an average of zero over the range of the data as constructed with the GAM. Log [π-GST (μg/L)] = 2.8 was an independent factor predicting postoperative stage 2 or 3 AKI.
