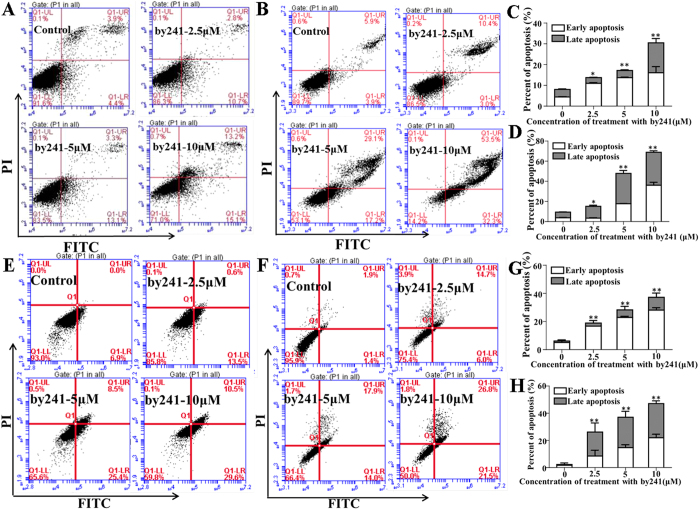
Figure 3. By241 induced cell apoptosis.
Apoptosis cells were detected using the Annexin V-FITC/PI double staining after exposure to by241 at different concentrations (0, 2.5, 5, 10 μM) and analyzed by flow cytometry and the apoptotic cell rate was analyzed after Annexin V-FITC/PI staining. (A,B) MGC-803 were treated for 12 h or 24 h; (E,F) EC9706 were treated for 12 h or 24 h; (C,D) Statistical analysis of apoptotic cells of (A,B); (G,H) Statistical analysis of apoptotic cells of (E,F); data are presented as the mean ± SD of three independent experiments. *P < 0.05 and **P < 0.01 were considered statistically compared to control.

