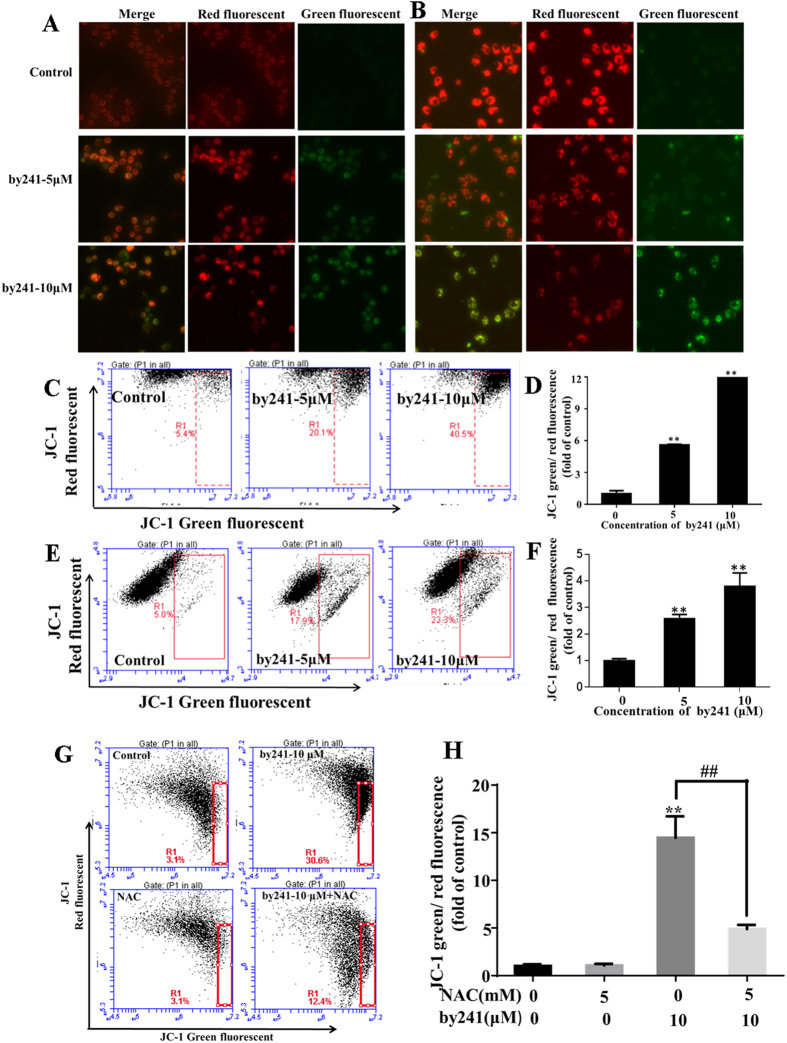
Figure 5. By241 induced mitochondrial dysfunction.
Cells were treated with 5, 10 μM of by241 for 24 hours, JC-1 staining image of (A) MGC-803 and (B) EC9706 cells were detected by fluorescence microscope, JC-1 staining red and green fluorescence intensity of (C) MGC-803 and (E) EC9706 cells analyzed by flow cytometry. (D,F) Quantitative analysis of the ratio of green/red fluorescence in Fig. 5C,E. (G) MGC-803 Cells were pretreated with or without 5 mM NAC for 2 hours, and then incubated with the by241 for another 24 hours, JC-1 staining red and green fluorescence intensity was analyzed by flow cytometry. (H) Quantitative analysis of the ratio of green to red fluorescence in Fig. 5G. Data are presented as the mean ± SD of three independent experiments. **P < 0.01 were considered statistically significant compared with the controls, ##P < 0.01 NAC+by241-10μM compared to by241–10 μM.

