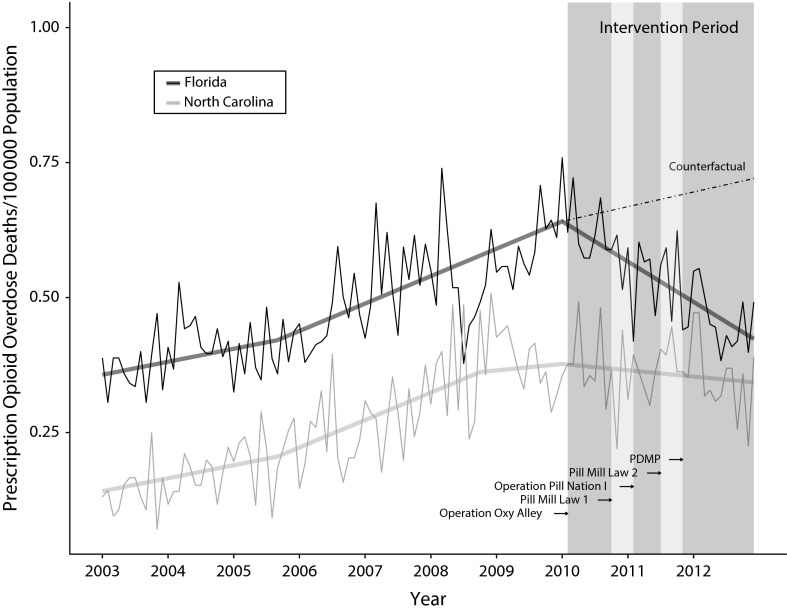
FIGURE 1—
Changes in Prescription Opioid Overdose Mortality Rates: Florida and North Carolina, 2003–2012
Note. PDMP = prescription drug monitoring program. The figure overlays the fitted multivariate adaptive regression spline (MARS) model on the observed prescription opioid overdose mortality rates in Florida and North Carolina. Under the counterfactual, we assumed that the rate of change in Florida’s prescription opioid overdose mortality rates would have changed by the same amount that North Carolina’s slope changed at the change point most proximate to the intervention period (January 2010). Note that the year labels indicate the start of each year (January) rather than the midpoint of each year.

