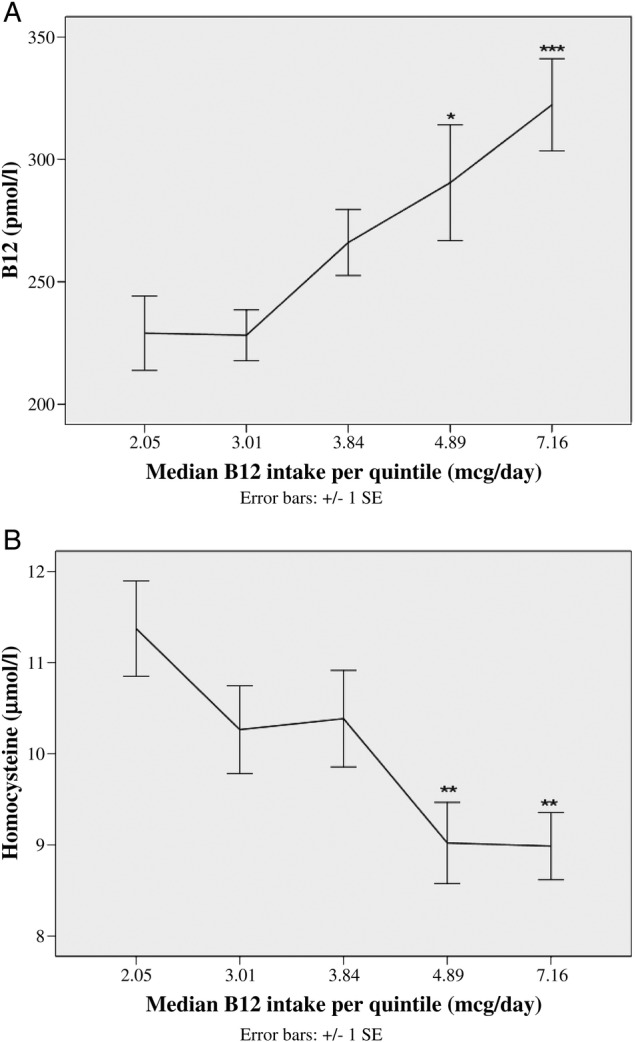
Figure 2.

Relationship between B12 intake in quintiles and (A) mean serum B12 and (B) mean plasma homocysteine concentrations. Mean±SEM values are plotted against the median B12 intake in each quintile. One-way analysis of variance (ANOVA) test used to compare the means between the quintiles (after log transformation) and Tukey’s post hoc analysis done. Mean biomarker levels differed as compared with quintile 1 as follows: *p<0.05; **p<0.01; ***p<0.001.
