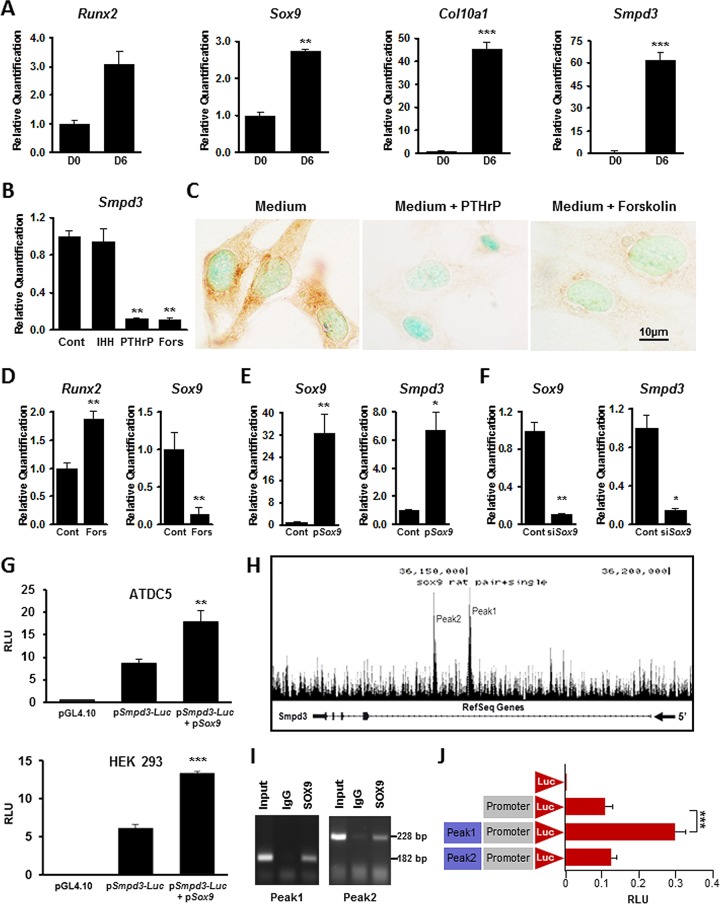
FIG 1.
Regulation of Smpd3 gene expression in vitro. (A) qRT-PCR analysis showing a significant upregulation of Smpd3 and chondrogenic markers Runx2, Sox9, and Col10a1 in differentiated ATDC5 cells. D0, day 0; D6, day 6. (B) Gene expression analysis showing a significant decrease in Smpd3 expression in ATDC5 cells treated with either 0.1 μM PTHrP or 25 μM forskolin. There was no effect on Smpd3 expression in cells treated with 0.5 μg/ml of IHH. (C) Immunocytochemistry using anti-SMPD3 antibody on differentiated ATDC5 cells treated with 0.1 μM PTHrP or 25 μM forskolin, showing the downregulation of SMPD3 expression. (D) Gene expression analysis showing the upregulation of Runx2 expression but a significant downregulation of Sox9 expression in ATDC5 cells treated with 25 μM forskolin. (E) Transfection of ATDC5 cells with a Sox9 expression vector (pSox9) increased both Sox9 and Smpd3 expression. (F) Sox9 knockdown by siRNA (siSox9) significantly decreased both Sox9 and Smpd3 gene expression in chondrogenic ATDC5 cells. (G) Luciferase assay showing the basal activation of the Smpd3 promoter in both ATDC5 (top) and HEK293 (bottom) cells. Cotransfection experiments with pSox9 resulted in a significant upregulation of the Smpd3 promoter activity in these cell types. (H) ChIP-seq analysis showing the presence of two distinct peaks, peak 1 and peak 2, in intron 1 of the rat Smpd3 gene. (I) ChIP assay showing the presence of 182-bp and 228 bp fragments corresponding to the SOX9 binding regions in peak 1 and peak 2, respectively. (J) Luciferase assay showing an almost 3-fold increase of the mouse Smpd3 promoter activity in the presence of a sequence corresponding to peak 1 but not in the presence of a sequence corresponding to peak 2 in RCS cells. Cont, control; Fors, forskolin; RLU, relative light units. *, P < 0.05; **, P < 0.01; ***, P < 0.001.

