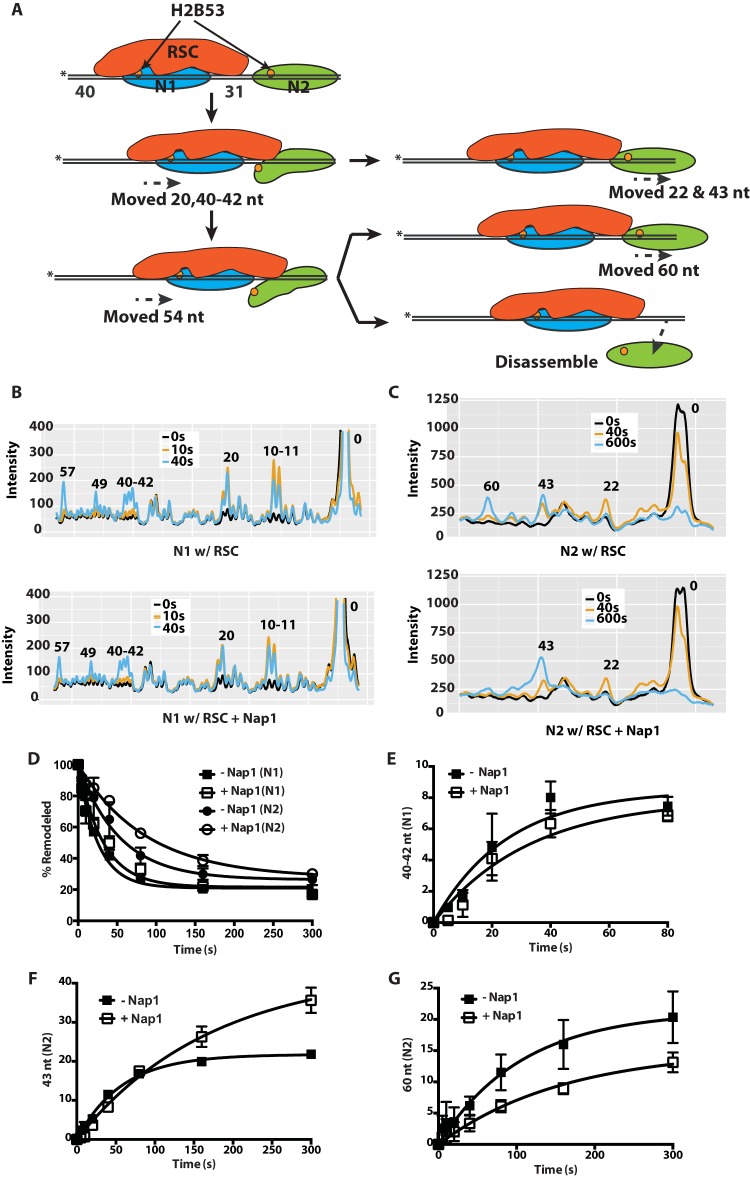
FIG 3.
Nap1 preferentially affects movement of the second nucleosome in a dinucleosome array. (A) Schematics showing RSC (red) mobilization of the N1 nucleosome (blue) and invasion into an adjacent N2 nucleosome with subsequent eviction (green). The location of the modified residue 53 in histone H2B is shown as an orange circle, and the asterisks indicate the positions of the radiolabel. (B and C) Samples were analyzed on a denaturing 6% polyacrylamide gel as shown in Fig. S2 in the supplemental material, and the gel was scanned with a Fuji FLA-5100. The phosphorimages of three time points, shown as different-color lines, were overlaid. The x and y axes are, respectively, the distance migrated on the gel and the relative band intensity plotted for RSC only and for RSC plus Nap1. The numbers above the peaks indicate the numbers of nucleotides from the dyad axis. The patterns for the N1 (B) and N2 (C) nucleosomes are shown. (D) The extents of movement of N1 and N2 nucleosomes are shown at different times with or without Nap1. (E to G) The amount of N1 nucleosomes moved 40 to 42 nt (E) and the amount of N2 nucleosomes moved 43 and 60 nt (F and G) in the presence or absence of Nap1 were plotted versus time. The data are the averages from two technical replicates. The error bars represent the standard deviations of the mean.

