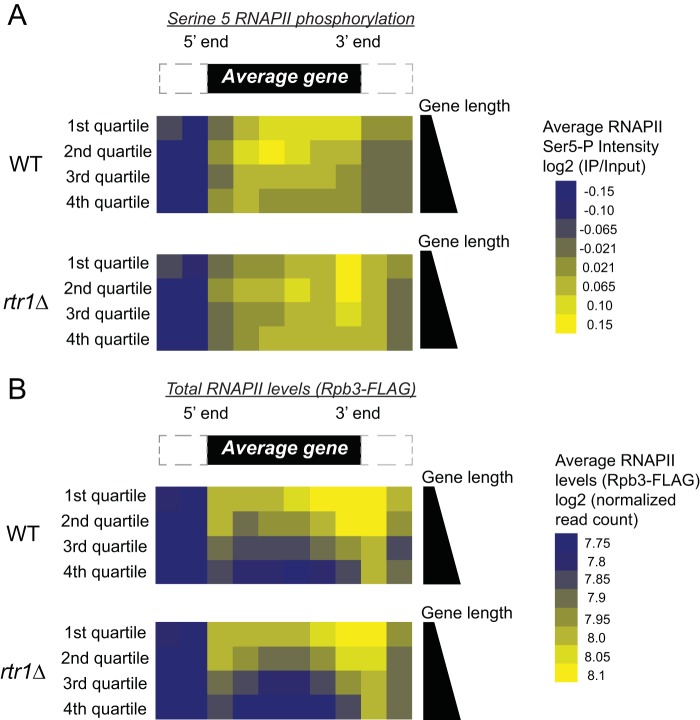
FIG 1.
Rtr1 affects the global distribution of Ser5-P RNAPII. (A) Average gene analysis from ChIP-chip experiments is shown in WT and rtr1Δ strains. Each heat map is divided into quartiles based on gene length, with the 1st quartile representing the shortest 25% of RNAPII target genes and the 4th quartile representing the longest 25% of RNAPII target genes. The color scale of Ser5-P RNAPII intensity is shown to the right. A schematic representation of an average gene is shown at the top. (B) Average gene analysis from median normalized Rpb3-FLAG ChIP-exo experiments is shown from WT and rtr1Δ strains. Each heat map is divided into quartiles based on gene length, with the 1st quartile representing the shortest 25% of RNAPII target genes and the 4th quartile representing the longest 25% of RNAPII target genes. The color scale of total RNAPII occupancy is shown to the right.

