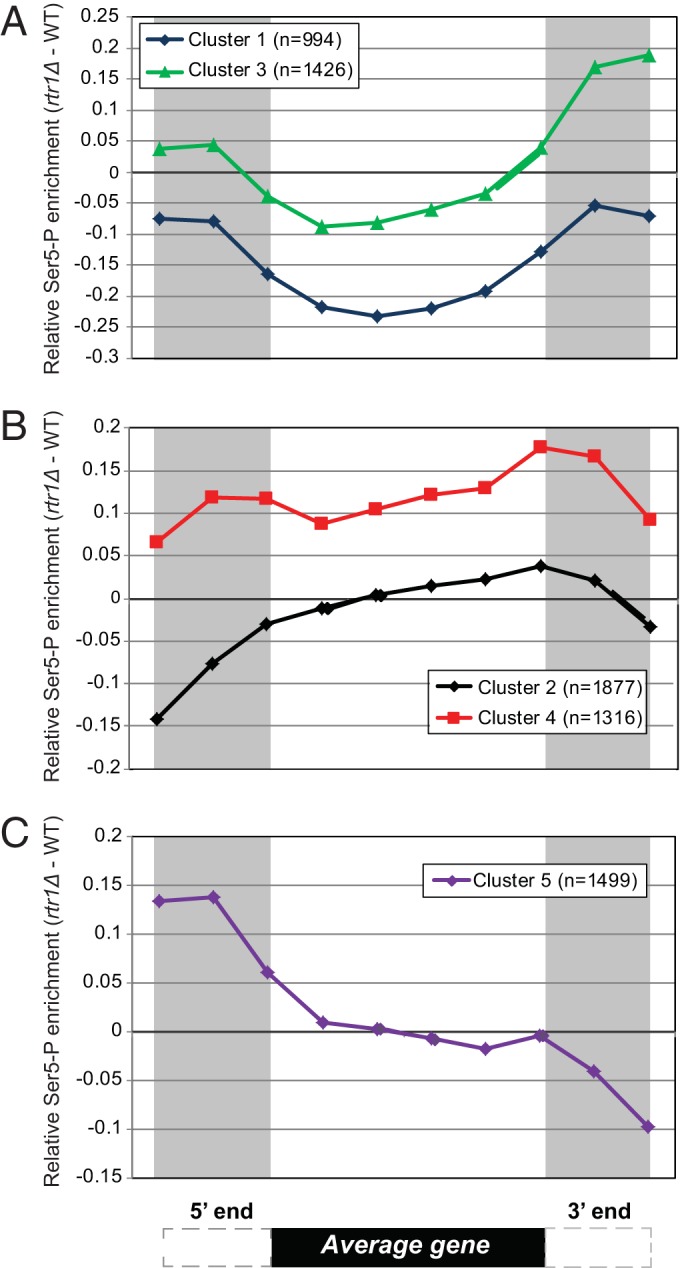
FIG 2.

ChIP-chip data plotted as the relative enrichment of Ser5-P (Ser5-P in rtr1Δ − Ser5-P in WT cells). Binned Ser5-P RNAPII ChIP-chip data were subjected to k-means clustering, and the average differential enrichment value [rtr1Δ IP − WT IP)/input] for each cluster was plotted. A schematic representation of an average gene is shown at the bottom of the figure. (A) Data from clusters 1 and 3 showing low relative RNAPII Ser5-P occupancy in the coding region of target genes in rtr1Δ strains. (B) Relative Ser5-P RNAPII enrichment in clusters 2 and 4 shows increased Ser5-P levels across the gene (cluster 4) and/or in the 3′ end of the average gene (clusters 2 and 4). (C) Increased levels of Ser5-P RNAPII were observed in rtr1Δ strains at the 5′ ends of cluster 5 genes.
