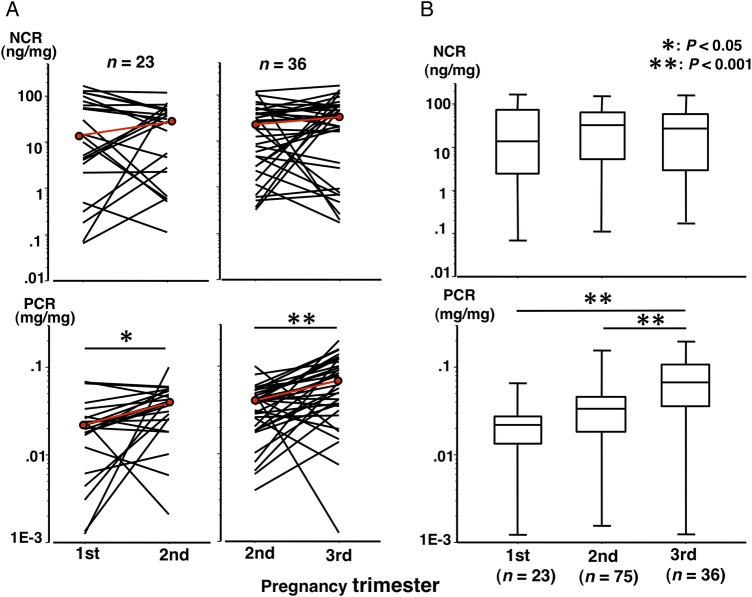
Figure 1.
Changes in nephrin:creatinine ratio (NCR) and protein:creatinine ratio (PCR) in normotensive control women. (A) The red line indicates changes in median values. Longitudinal paired urine samples for the first and second trimesters and for the second and third trimesters were available in 23 and 36 normotensive control women, respectively. The median NCR (ng/mg) was 13.8 vs 28.3 (p=0.2735) for the first versus second trimester in the 23 women, respectively, and was 22.1 vs 26.6 (p=0.2264) for the second versus third trimester in the 36 women, respectively. The median PCR (mg/mg) was 0.022 vs 0.040 (p=0.0126) for the first versus second trimester in the 23 women, respectively, and was 0.040 vs 0.068 (p<0.0001) for the second versus third trimester in the 36 women, respectively. In 18 women with three urine samples including one each collected during the first, second and third trimesters, NCR (ng/mg) did not change significantly (14.3, 30.0 and 34.7 for the first, second and third trimesters, respectively), while PCR (mg/mg) increased significantly with advancing gestational week (0.020, 0.039 and 0.065 for the first, second and third trimesters, respectively; p=0.0096 for the first versus second trimester level and p=0.0065 for the second versus third trimester level). (B) There were 34 other women in whom only second trimester urine samples were available. Data for these 34 women were combined with the data shown in (A). The median NCR (ng/mg) were 13.8, 32.3 and 26.6 for the first, second and third trimesters, respectively. The median PCR (mg/mg) was 0.022, 0.033 and 0.068 for the first, second and third trimesters, respectively. The median nephrin concentrations (ng/mL) were 10.4, 25.1 and 21.1 for the first, second and third trimesters, respectively. The median protein concentrations (μg/mL) were 20.6, 21.9 and 32.4 for the first, second and third trimesters, respectively.

