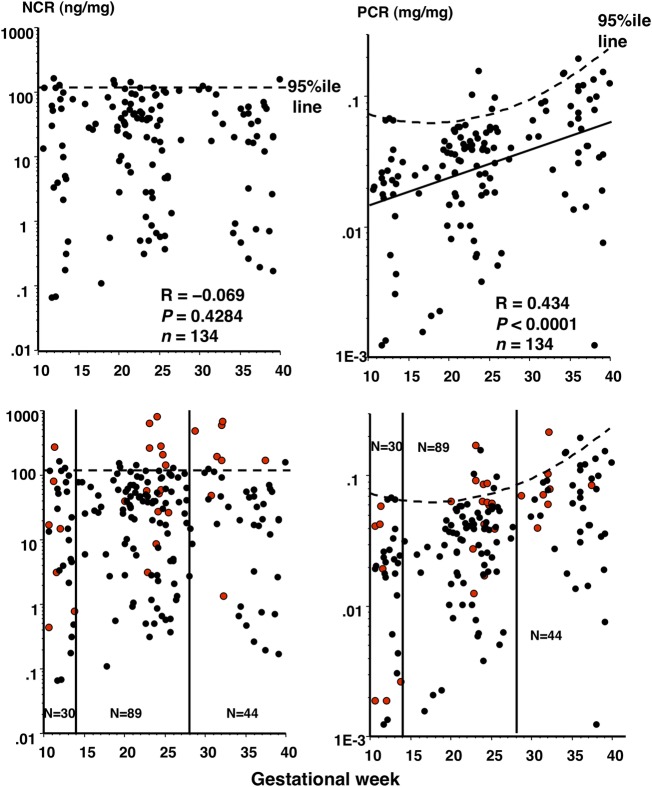
Figure 4.
Correlation of nephrin:creatinine ratio (NCR) and protein:creatinine ratio (PCR) with gestational week in normotensive control women and possibility of NCR as a screening tool for prediction of pre-eclampsia (PE) onset. Upper panels: all 134 data on NCR and PCR of control women were plotted against gestational week. Dotted straight and curved lines indicate the 95th centile NCR and PCR levels, respectively, according to gestational week in normotensive control women. Since the NCR level did not change in pregnancy (no significant correlation between the NCR level and gestational week, R=−0.069, p=0.4284), the 95th centile NCR value was determined in 134 samples. Since PCR exhibited a significant correlation with gestational week, showing an oblique linear regression (solid line on the right, R=0.434, p<0.0001), the curved line was obtained showing the variable 95th centile PCR values according to gestational week. Lower panels: 28 data on NCR and PCR (red dots) of 14 women with PE were superimposed onto the upper panels. All 28 urine samples (7, 14 and 8 samples from 7, 14 and 8 women with PE during the first, second and third trimesters, respectively) were collected before onset of significant proteinuria in pregnancy (SPIP) and hypertension. Vertical lines separate pregnancy trimesters. When multiple urine samples were available within the same pregnancy trimester in a woman with PE, urine samples at the latest gestational week and at the day closest to gestational week 24 were chosen as first and third, and second trimester samples, respectively. Thus, totals of 30 (23 and 7 from control women and women with PE, respectively), 89 (75 and 14 from control women and women with PE, respectively) and 44 (36 and 8 from control women and women with PE, respectively) data are depicted for the first, second and third trimesters, respectively. The 95th NCR value (122 ng/mg) appeared to more efficiently differentiate between women with and without later development of PE than the 95th PCR value: for women with NCR above and below the 95th value, the risks of later development of PE were 33% (1/3) vs 22% (6/27) with p=0.6496 for the first trimester, 60% (6/10) vs 10% (8/79) with p<0.0001 (relative risk (RR), 5.93; 95% CI 2.59 to 13.6) for the second trimester, and 75% (6/8) vs 5.5% (2/36) with p=0.0003 (RR, 13.5; 95% CI 3.31 to 55.0) for the third trimester, respectively, and for women with PCR above and below the 95th value, the values were 0.0% (0/2) vs 25% (7/28) with p=0.7409 for the first trimester, 50% (4/8) vs 12% (10/81) with p=0.0024 (RR, 4.06; 95% CI 1.64 to 10.0) for the second trimester, and 33% (1/3) vs 17% (7/41) with p=0.755 for the third trimester, respectively.

