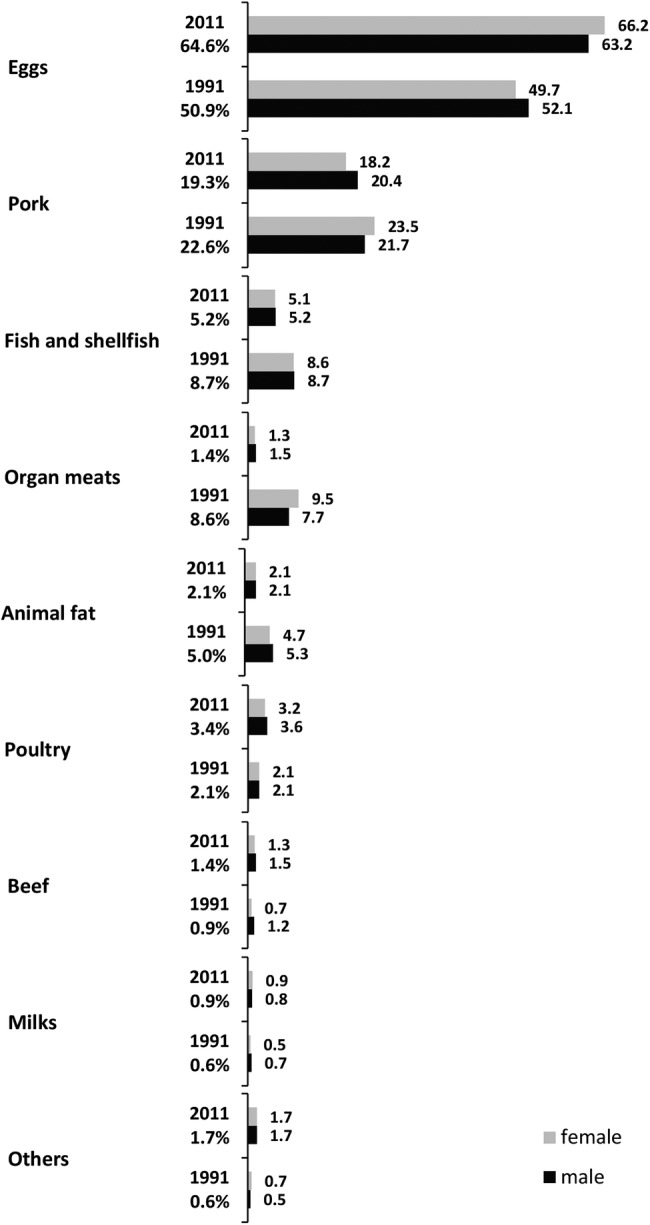
Figure 1.

Contribution of food items to total daily cholesterol intake in elderly Chinese in 1991 and 2011. Values are expressed as percentages. Grey and black bars denote the proportions in women and men, respectively.

Contribution of food items to total daily cholesterol intake in elderly Chinese in 1991 and 2011. Values are expressed as percentages. Grey and black bars denote the proportions in women and men, respectively.