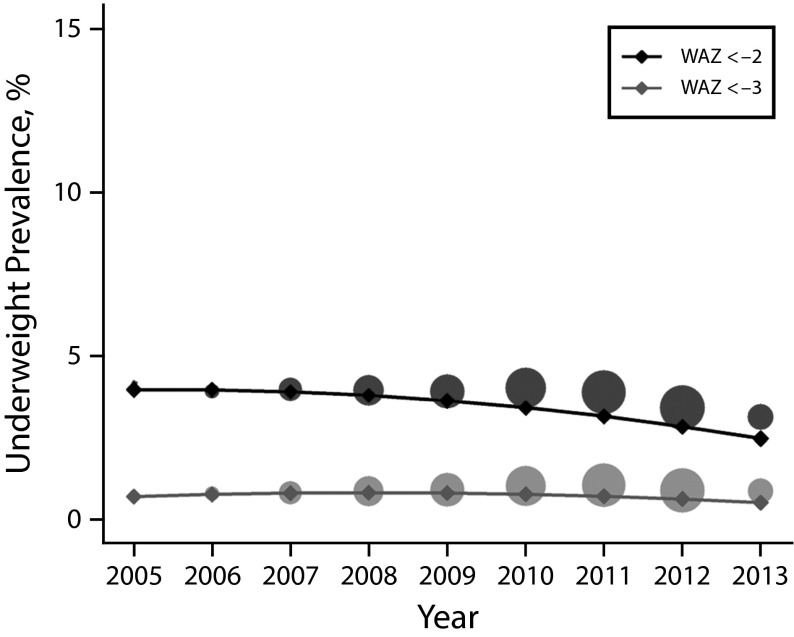
FIGURE 2—
Estimated Trends and Empirical Underweight Prevalence in Children Younger Than 5 Years Covered by the Universal Health Coverage Programs: Argentina, 2005–2013
Note. WAZ = weight-for-age z-score. We estimated prevalence of underweight (WAZ < −2) and severe underweight (WAZ < −3) for the whole population using linear mixed effects (LME) model A (solid line) to the whole data set and then conditioning to the mean (observed) values of gender, urban vs rural residence, and age. Circles represent empirical proportions, with the total area proportional to the number of records in the year.

