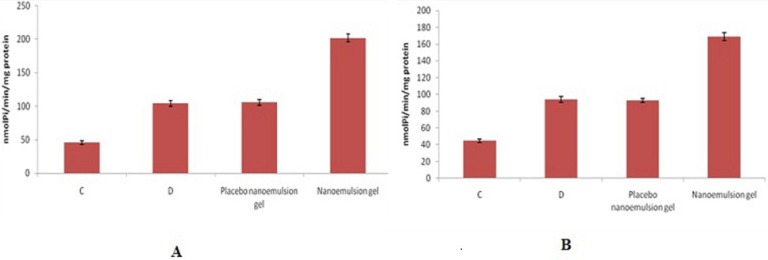
Figure 7.
ATP (7a) and ADP (7b) hydrolysis in lymphocytes obtained from the control group (C), contact dermatitis group (D), groups with dermatitis treated with placebo nanoemulsion, and drug loaded nanoemulsion. Data were analyzed statistically by one-way ANOVA followed by the Tukey-Kramer test (a) and Kruskal-Wallis Test (b), (p < 0.05

