Fig. 3.

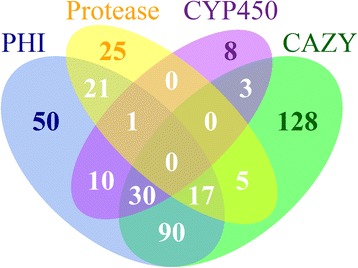
Venn-plot showing the intersections among the secreted PHI proteins (blue), secreted proteases (yellow), secreted CYP450 enzymes (darkorchid), and secreted CAZymes (green)

Venn-plot showing the intersections among the secreted PHI proteins (blue), secreted proteases (yellow), secreted CYP450 enzymes (darkorchid), and secreted CAZymes (green)