
Fig. 2.
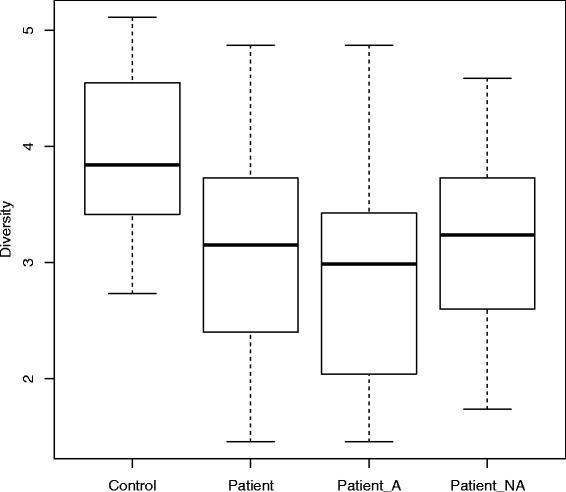
Box-plots of the alpha diversity (based on OTUs at 97 % indentity threshold) of the Control and Patient groups. The Patient group is further partitioned into the group taking antibiotics 1-month period Visit 1 (Patient_A) and the group not taking antibiotics (Patient_NA). The Y-axis denotes alpha diversity (Shannon Index values). The mean alpha-diversity values for the various groups are 3.92 (Control), 3.07 (Patient), 2.96 (Patient_A), and 3.25 (Patient_NA). The Patient group has a lower microbiota diversity (statistically significant) compared to the Control group (p-value = 0.0012). The diversities of the Patient_A and Patient_NA groups are also significantly lower (p-value < 0.05) than the Control group