
Fig. 3.
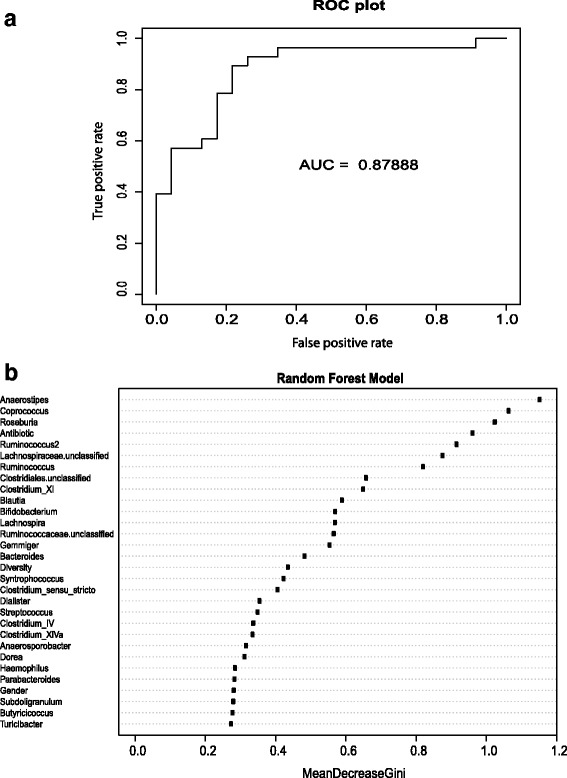
Random Forest analysis to distinguish between Patient and Control groups based on microbiota profiles (and sample metadata). The top figure Receiver Operating Characteristic (ROC) plot (a) shows the classification accuracy (as evaluated by AUC) while the bottom figure (b) lists the input features in decreasing order of importance (based on MeanDecreaseGini values)