
Fig. 4.
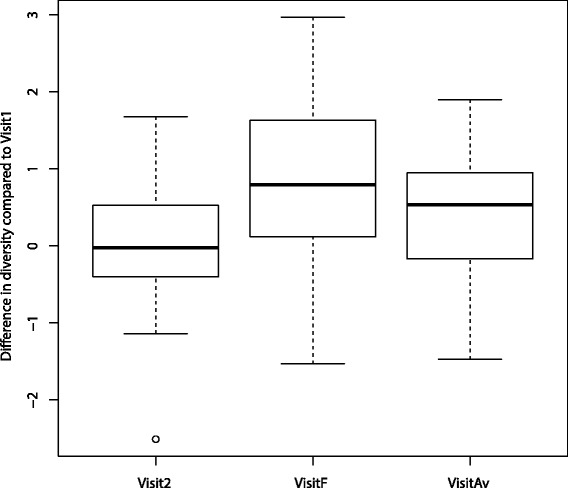
Microbiota diversity increases over the course of chemotherapy. Visit2 denotes the diversity difference between Visit 2 and Visit 1; VisitF denotes the diversity difference between the final visit and Visit 1; VisitAv denotes the difference in average diversity after Visit 1 and diversity at Visit 1. All three differences have mean values >0, and both VisitF and VisitAv are statistically significantly different (from 0)