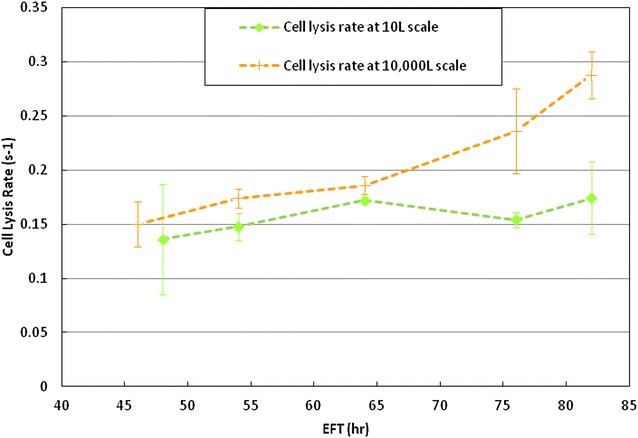
Fig. 2.

Comparison of cell lysis rates (s−1) shown by the PRD strain throughout the fermentation time between scales 10 and 10,000 L scale. The green and orange dashed lines represent the cell lysis rates profiles at 10 and 10,000 L, respectively. Those cell lysis rates were calculated as described in “Methods” section. All rate determinations at 10 L were by duplicate. All rate determinations at 10,000 L were by triplicate. Error bars represented one standard deviation
