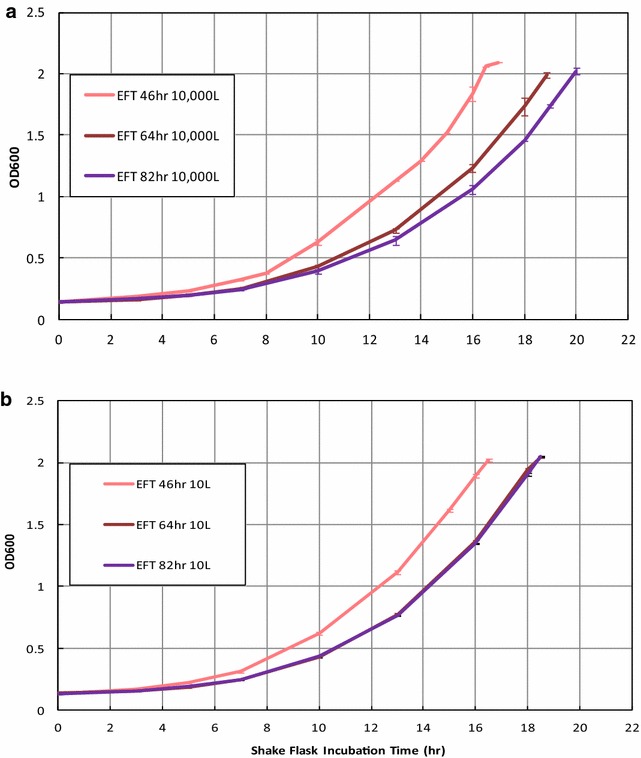
Fig. 4.

Growth curves for inoculums from 10,000 and 10 L sampled at EFT 46, 64, and 82 h. a Optical densities at 600 nm (OD600) versus incubation time of corresponding shake flasks inoculated with samples at EFT 46 h (pink), 64 h (brown), and 82 h (purple) from 10,000 L production bioreactors. b OD600 temporal profiles corresponding to shake flasks inoculated with samples at the indicated EFTs from 10 L production bioreactors. Optical densities at 600 nm (OD600) measured as detailed in “Methods” section. All determinations are by duplicate. Error bars represented one standard deviation
