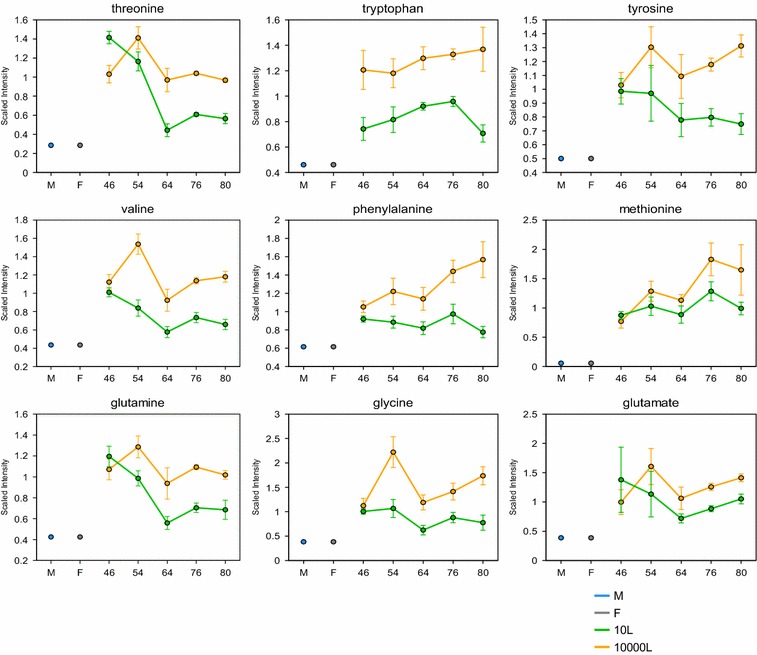
Fig. 7.

Line plot graphs of amino acids in the media from 10 L (green line) and 10,000 L (orange line) fermentations. The intermediates measurement and data analysis were determined as described in “Methods” section. Error bars represents “mean ± one standard deviation”. “M” and “F” in the time axis for every line plot stand for medium and feed samples, respectively
