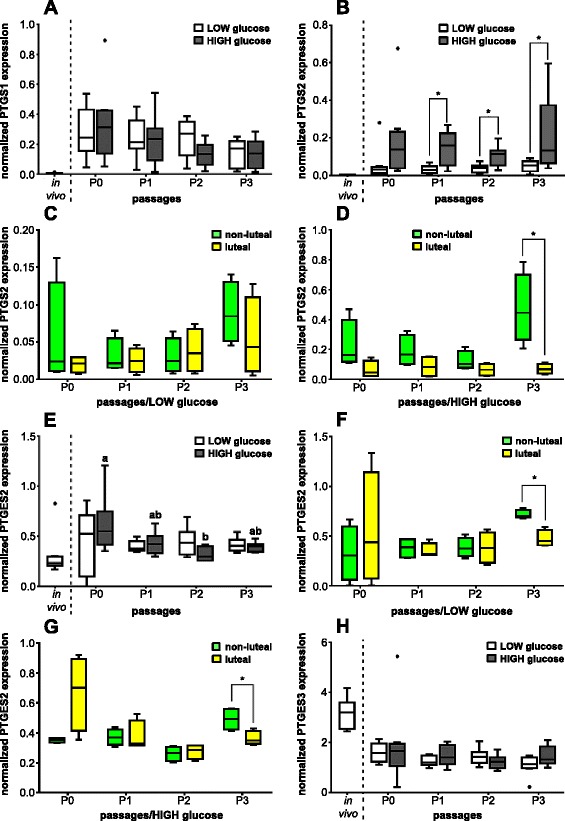
Fig. 3.

Effect of passage number or estrous cycle stage on PG synthesis enzyme mRNA expression pattern. Normalized mRNA expression of a PTGS1; b PTGS2; e PTGES2; and h PTGES3 in BOEC of in vivo samples and of cell culture passages P0, P1, P2 and P3 with LOW and HIGH glucose medium content (n = 8) as well as normalized mRNA expression depending of the phase of the estrous cycle on day of collecting cells of c PTGS2 in LOW glucose medium; d PTGS2 in HIGH glucose medium; f PTGES2 in LOW glucose medium; and g PTGES2 in HIGH glucose medium (n = 4). Different letters indicate significant difference (P < 0.05) between cell culture passages of the same glucose medium content. Asterisk on top of the line represents significant difference between different glucose content of medium at each cell culture passage or between the different estrous cycle phases on day of collection (P < 0.05)
