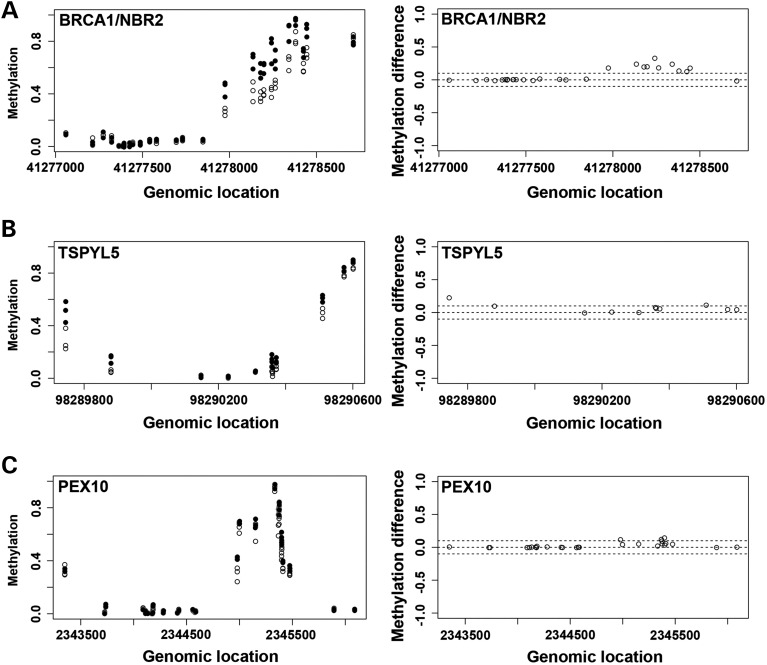
Figure 4.
Probes clusters showing hypermethylation in three genes on ubiquitin proteolysis pathway. Plots demonstrate the distribution of DNA methylation levels and methylation difference (β-value difference) between T2118W (filled circle) and CON18W (open circle) along the genomic locations for the probes clusters on BRCA1/NBR2 (A), TSPYL5 (B) and PEX10 (C) in ubiquitin proteolysis pathway. These cluster changes are pulled out by bumphunter. The dash line indicates the levels of methylation difference at 0.1 and −0.1.

