Fig. 3.

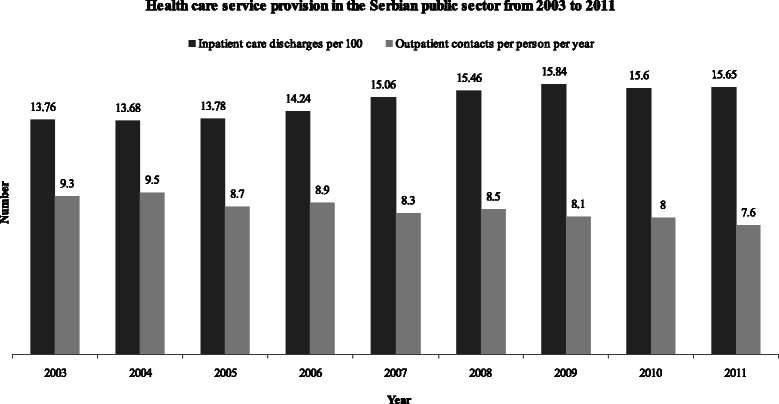
Health care service provision in the Serbian public sector from 2003 to 2011. Black columns represent inpatient care discharges per 100 population; gray columns represent outpatient contacts per person per year

Health care service provision in the Serbian public sector from 2003 to 2011. Black columns represent inpatient care discharges per 100 population; gray columns represent outpatient contacts per person per year