
Fig. 5.
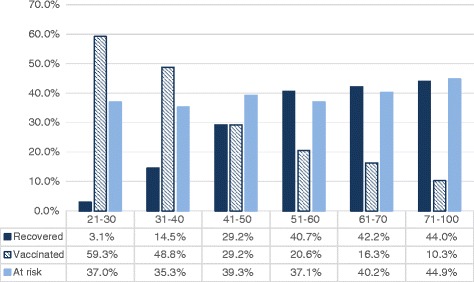
Acquisition of immunity in all age groups. The percentage values represent percent of participants in each age group
Official websites use .gov
A
.gov website belongs to an official
government organization in the United States.
Secure .gov websites use HTTPS
A lock (
) or https:// means you've safely
connected to the .gov website. Share sensitive
information only on official, secure websites.
Acquisition of immunity in all age groups. The percentage values represent percent of participants in each age group