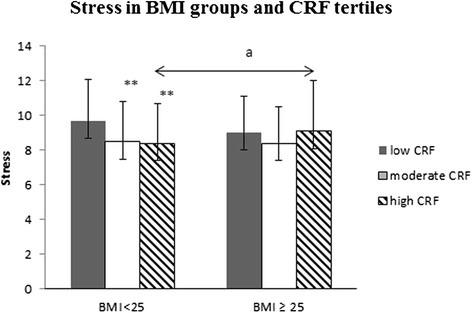
Fig. 1.

Stress symptoms according to Body Mass Index (BMI) groups and cardiorespiratory fitness (CRF) tertiles. Mean (±SD). The ANCOVA model includes age, tobacco and alcohol use and muscle fitness (MF) and leisure-time physical activity (LTPA) as covariates. Differences between the low and moderate/high subgroups within the BMI < 25 group: *0.01 < p ≤ 0.05, **0.001 < p ≤ 0.01, ***p < 0.001. Differences between the overweight and normal-weight subgroups within the fitness tertiles: a) p ≤ 0.05
