
Fig. 8.
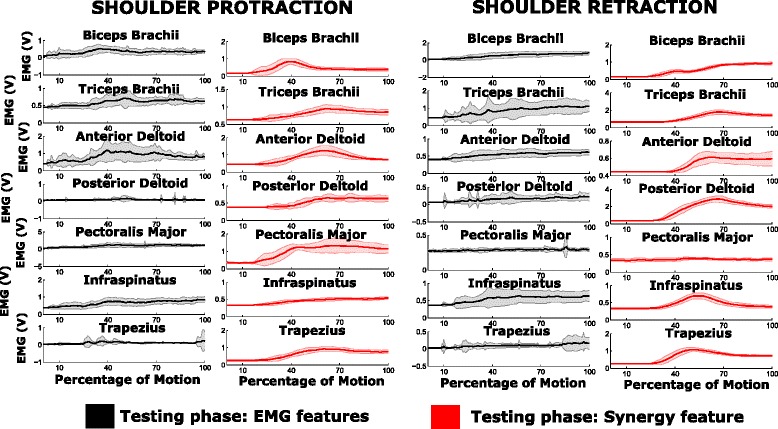
EMG activity during training and testing phase. Represents the mean and standard deviation plot of the EMG activity for subject 4 in each of the motion-classes. The plots in black and red pertains to the EMG activity during testing phase (20 repetitions) corresponding to EMG features and synergy feature respectively